. 2008 Oct;7(10):1648-62.
doi: 10.4161/cbt.7.10.6623. Epub 2008 Oct 12.

Vorinostat and sorafenib increase ER stress, autophagy and apoptosis via ceramide-dependent CD95 and PERK activation

Affiliations

Vorinostat and sorafenib increase ER stress, autophagy and apoptosis via ceramide-dependent CD95 and PERK activation

Margaret A Park et al. Cancer Biol Ther. 2008 Oct.

Abstract

We recently noted that low doses of sorafenib and vorinostat interact in a synergistic fashion to kill carcinoma cells by activating CD95, and this drug combination is entering phase I trials. The present studies mechanistically extended our initial observations. Low doses of sorafenib and vorinostat, but not the individual agents, caused an acidic sphingomyelinase and fumonisin B1-dependent increase in CD95 surface levels and CD95 association with caspase 8. Knock down of CD95 or FADD expression reduced sorafenib/vorinostat lethality. Signaling by CD95 caused PERK activation that was responsible for both promoting caspase 8 association with CD95 and for increased eIF2alpha phosphorylation; suppression of eIF2alpha function abolished drug combination lethality. Cell killing was paralleled by PERK-and eIF2alpha-dependent lowering of c-FLIP-s protein levels and overexpression of c-FLIP-s maintained cell viability. In a CD95-, FADD- and PERK-dependent fashion, sorafenib and vorinostat increased expression of ATG5 that was responsible for enhanced autophagy. Expression of PDGFRbeta and FLT3 were essential for high dose single agent sorafenib treatment to promote autophagy. Suppression of PERK function reduced sorafenib and vorinostat lethality whereas suppression of ATG5 levels elevated sorafenib and vorinostat lethality. Overexpression of c-FLIP-s blocked apoptosis and enhanced drug-induced autophagy. Thus sorafenib and vorinostat promote ceramide-dependent CD95 activation followed by induction of multiple downstream survival regulatory signals: ceramide-CD95-PERK-FADD-pro-caspase 8 (death); ceramide-CD95-PERK-eIF2alpha- downward arrowc-FLIP-s (death); ceramide-CD95-PERK-ATG5-autophagy (survival).


Figures
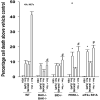
Figure 1
Figure 1. Sorafenib and Vorinostat interact in a synergistic fashion to kill transformed cells via CD95 and PERK-eIF2α -induced suppression of c-FLIP-s levels
Panel a. SV40 Large T antigen transformed mouse embryonic fibroblasts lacking expression or with over-expression of various pro- / anti-apoptotic genes were plated in triplicate and treated with vehicle (DMSO), sorafenib (3.0 μM), vorinostat (500 nM) or both sorafenib and vorinostat. Forty eight hours after drug exposure, cells were isolated and viability determined by trypan blue assay. The percentage of trypan blue positive cells ± SEM (n = 3) was determined. # p < 0.05 less cell killing than compared to parallel condition in vehicle treatment cells. Panel b. section (i). HEPG2 hepatoma and UOK121LN renal cells were plated and treated 24h after plating with vehicle (DMSO), sorafenib (3.0 μM), vorinostat (500 nM) or both sorafenib and vorinostat. Six and 24 hours after drug exposure, cells were isolated and subjected to SDS PAGE followed by immunoblotting to determine the expression of c-FLIP-s and ERK2. Data are from a representative study (n = 3). section (ii) HEP3B cells were transfected with either an empty vector plasmid (CMV) or to express dominant negative eIF2α S51A. Twenty four hours after plating, cells were treated with vehicle (DMSO), or with sorafenib (Sor., 3.0 μM) and vorinostat (Vor., 500 nM). Cells were isolated 6h or 24h, as indicated, after drug exposure and the expression of c-FLIP-s and GAPDH determined at each time point. A representative study (n = 2) is shown. Panel c. section (i) HEPG2 cells were infected to express empty vector (CMV) or c-FLIP-s. Cells were treated with vehicle (DMSO), sorafenib (3.0 μM), vorinostat (500 nM) or both sorafenib and vorinostat. Twelve hours after drug exposure, cells were isolated and the crude granular and cytosolic fractions isolated. The release of cytochrome c into the cytosolic fraction was determined after SDS PAGE and immunoblotting (n = 2). section (ii) HEPG2 cells were infected to express empty vector (CMV) or c-FLIP-s or HEP3B cells transfected to express empty vector or dominant negative eIF2α S51A. Cells were treated with vehicle (DMSO), sorafenib (3.0 μM), vorinostat (500 nM) or both sorafenib and vorinostat. Ninety six hours after drug exposure (HEPG2) or 48h after exposure (HEP3B), cells were isolated and viability determined by trypan blue assay. The percentage of trypan blue positive cells ± SEM (n = 3) was determined. # p < 0.05 less cell killing than compared to parallel condition in vehicle treatment cells. Panel d. Human malignant melanoma cells were plated in triplicate and treated with vehicle (DMSO), sorafenib (3.0 μM), vorinostat (500 nM) or both sorafenib and vorinostat. After drug exposure (48h), cells were isolated and viability determined by trypan blue assay. The percentage of trypan blue positive cells ± SEM (n = 3) was determined. # p < 0.05 less cell killing than compared to parallel condition in vehicle treatment cells. Panel e. MEL-2 cells were infected to express empty vector (CMV) or c-FLIP-s. Cells were treated with vehicle (DMSO), sorafenib (3.0 μM), vorinostat (500 nM) or both sorafenib and vorinostat. Forty eight hours after drug exposure, cells were isolated and viability determined by trypan blue assay. The percentage of trypan blue positive cells ± SEM was determined. Data shown are from the mean of 3 independent studies. # p < 0.05 less cell killing than compared to parallel condition in vehicle treatment cells. upper microscopy: MEL-2 cells were plated on glass slides and treated 24h after plating with vehicle (DMSO) or with sorafenib (3.0 μM) and vorinostat (500 nM). Six hours after drug exposure, cells were fixed in situ. Fixed cells were blocked then incubated with an anti-CD95 antibody. Cells were then incubated with a 488nm-tagged fluorescent secondary antibody. Cells were washed, cover-slipped and analyzed on a fluorescent microscope (X100 mag.). The intensity of CD95 staining was determined at 50 random points per cell for a total of 5 cells ± SEM (n = 3 separate studies). Panel f. MEL-2 cells were transfected with a non-specific scrambled control (siSCR) siRNA molecule or a molecule to knock down the expression of CD95 according to the manufacturer’s instructions. Cells were treated 24h after transfection with vehicle (DMSO), sorafenib (3.0 μM), vorinostat (500 nM) or both sorafenib and vorinostat. Ninety six hours after drug exposure, cells were isolated and viability determined by trypan blue assay. The percentage of trypan blue positive cells ± SEM was determined. Data shown are from the mean of 3 independent studies. # p < 0.05 less cell killing than compared to parallel condition in vehicle treatment cells. upper blotting: MEL-2 cells infected to express empty vector (CMV) or c-FLIP-s and treated 24h after infection with vehicle (DMSO) or with sorafenib (3.0 μM) and vorinostat (500 nM). Cells were isolated 6h after sorafenib and vorinostat exposure and CD95 immunoprecipitated from the cell lysate. SDS PAGE followed by immunoblotting of CD95 immunoprecipitates was performed to determine the association of pro-caspase 8 and caspase 8 with CD95. Data are from a representative study (n = 3).
Figure 2
Figure 2. Sorafenib and Vorinostat interact to cause tumor cell death in vivo; sorafenib and vorinostat promote PERK activation and the induction of autophagy
Panel a. HEPG2 and UOK121LN cells were plated and treated 24h after plating with vehicle (DMSO), sorafenib (3.0 μM), vorinostat (500 nM) or both sorafenib and vorinostat. Six and 24 hours after drug exposure, cells were isolated and subjected to SDS PAGE followed by immunoblotting to determine the expression of BiP/Grp78, LC3, Beclin1, ATG5 and GAPDH and the phosphorylation of eIF2α S51 and PERK T981. Panel b. HEP3B cells were injected (107) into the flanks of athymic mice and tumors permitted to form. The tumor take-rate was approximately 20%. Tumors were permitted to grow to ∼150 mm3 after which time tumors were segregated based on volume into relatively normalized groups. Animals / tumors in triplicate were subjected to vehicle / drug administration by oral gavage once daily for three consecutive days. BAY 54-9085 was administered at a dose of 45 mg/kg. Vorinostat was administered at a dose of 25 mg/kg. Twelve hours after the final gavage dosing, the animals were humanely sacrificed, the tumors were removed and sectioned. The tumor was subjected for immunohistochemical analyses to determine eIF2α phosphorylation, ERK1/2 phosphorylation, AKT (S473) phosphorylation, and the expression of ATG5, c-FLIP-s, MCL-1, caspase 3 cleavage status, and TUNEL positivity (n = 2 separate experiments). Panel c. HEPG2 cells were transfected with an LC3-GFP construct. Twenty four hours after transfection, cells were treated with vehicle (DMSO), sorafenib (3.0 μM), vorinostat (500 nM) or both sorafenib and vorinostat. Six and 24 hours after drug exposure, cells were visualized at 40X using an Axiovert 200 fluorescent microscope under fluorescent light on the Zeiss Axiovert 200 microscope using the FITC filter, and visible light. The mean number of autophagic vesicles per cell from random fields of 40 cells were counted (± SEM, n = 3). The pictorial data shown is from a representative experiment (n = 3). Panel d. HEPG2 cells were transfected with an LC3-GFP construct and simultaneously transfected with either a scrambled siRNA (siSCR) or validated siRNA molecules to knock down the expression of the PDGFRα, PDGFRβ, FLT1 or FLT3. Twenty four hours after transfection, cells were treated with vehicle (DMSO) or sorafenib (6.0 μM) for 6h. cells were visualized at 40X using an Axiovert 200 fluorescent microscope under fluorescent light on the Zeiss Axiovert 200 microscope using the FITC filter, and visible light. The mean number of autophagic vesicles per cell from random fields of 50 cells were counted (± SEM, n = 5). *p < 0.05 greater than vehicle control; #p < 0.05 less than corresponding value in siSCR treated cells; %p > 0.05 greater / less than corresponding value in siSCR treated cells. Panel e. Wild type and cathepsin B -/- immortalized fibroblasts were transfected with an LC3-GFP construct. Twenty four hours after transfection, cells were treated with vehicle (DMSO), sorafenib (3.0 μM), vorinostat (500 nM) or both sorafenib and vorinostat. Six hours after drug exposure, cells were visualized at 40X under fluorescent light on the Zeiss Axiovert 200 microscope using the FITC and Rhodamine filters, as well as visible light. The mean number of autophagic vesicles per cell from random fields of 40 cells were counted (± SEM, n = 2). The upper pictorial data from parallel treated cells stained with lysotracker red (see ref ; n = 40 per slide examined) and examined under the rhodamine filter are from a representative experiment (n = 2). Cells were merged in Adobe Photoshop CS2 to examine LC3-GFP vesicle and lysotracker red staining co-localization.
Figure 3
Figure 3. Sorafenib and vorinostat treatment modulates DISC formation, ER stress signaling and autophagy via CD95-PERK signaling
Panel a. HEPG2 and UOK121LN cells were plated on glass slides and either transfected to express dominant negative PERK or transfected to knock down expression of ATG5. Cells were treated 24h after transfection with vehicle (DMSO) or with sorafenib (3.0 μM) and vorinostat (500 nM). Six hours after drug exposure, cells were fixed in situ. Fixed cells were blocked then incubated with an anti-CD95 antibody. Cells were then incubated with a 488nm-tagged fluorescent secondary antibody. Cells were washed, cover-slipped and analyzed on a fluorescent microscope (X100 magnification). The intensity of CD95 staining was determined at 50 random points per cell for a total of 5 cells ± SEM (n = 3 separate studies). Panel b. Upper panel: HEPG2 cells transfected to express empty vector (CMV) or dominant negative PERK (dnPERK) and treated 24h after infection with vehicle (DMSO) or with sorafenib (3.0 μM) and/or vorinostat (500 nM). Cells were isolated 6h after sorafenib and vorinostat exposure and CD95 immunoprecipitated from the cell lysate. SDS PAGE followed by immunoblotting of CD95 immunoprecipitates was performed to determine the association of pro-caspase 8 and caspase 8 with CD95. Data are from a representative study (n = 2). Lower panel: HEPG2 cells transfected to express empty vector (CMV) or dominant negative PERK (dnPERK) and treated 24h after infection with vehicle (DMSO) or with sorafenib (3.0 μM) and vorinostat (500 nM). Cells were isolated 24h after sorafenib and vorinostat exposure and the expression of ATG5 and GAPDH determined by SDS PAGE followed by immunoblotting (a representative, n = 2). Panel c. HEPG2 cells were transfected with an LC3-GFP construct and co-transfected either to express dominant negative PERK or co-transfected to knock down expression of ATG5. Twenty four hours after transfection, cells were treated with vehicle (DMSO), sorafenib (3.0 μM), vorinostat (500 nM) or both sorafenib and vorinostat. Twenty four hours after drug exposure, cells were visualized at 40X using an Axiovert 200 fluorescent microscope under fluorescent light on the Zeiss Axiovert 200 microscope using the FITC filter. The mean number of autophagic vesicles per cell from random fields of 40 cells were counted (± SEM, n = 3). The upper immunoblotting sections are presented for control purposes to demonstrate that expression of dominant negative PERK blocked drug-induced phosphorylation of eIF2α and that the siRNA to ATG5 knocked down ATG5 expression (n = 2). Panel d. Graphical panel: HEPG2 cells were plated in triplicate and either transfected to express dominant negative PERK or transfected to knock down expression of ATG5. Cells were treated 24h after transfection with vehicle (DMSO) or with sorafenib (3.0 μM) and vorinostat (500 nM). Forty eight hours after drug exposure cells were isolated and cell viability determined by TUNEL assay (± SEM, n = 2 independent assays). Upper inset blot to left: in cells transfected with dominant negative PERK the ability of vorinostat and sorafenib to promote pro-caspase 8 cleavage was determined 48h after drug exposure. Upper inset blot to right: HEPG2 cells were plated in triplicate and transfected to knock down expression of ATG5. Cells were treated 24h after transfection with vehicle (DMSO) or with sorafenib (3.0 μM) and vorinostat (500 nM). Six h after drug exposure cells were lysed and CD95 immunoprecipitated from the cell lysate. SDS PAGE followed by immunoblotting of CD95 immunoprecipitates was performed to determine the association of pro-caspase 8 and caspase 8 with CD95. Data are from a representative study (n = 3).
Figure 4
Figure 4. Sorafenib and vorinostat -induced activation of PERK is CD95-dependent
Panel a. HEPG2 cells were transfected to knock down expression of CD95 or FADD. Cells were treated 24h after transfection with vehicle (DMSO), sorafenib (3.0 μM), vorinostat (500 nM) or both sorafenib and vorinostat. Six hours after drug exposure, cells were isolated and subjected to SDS PAGE followed by immunoblotting to determine the expression of FADD, CD95, ATG5 and GAPDH, and in parallel the phosphorylation of PERK and eIF2α. Data are from a representative study (n = 3). Lower right: In parallel as a positive control, 6h after drug exposure, CD95 was immunoprecipitated and the formation of a DISC complex containing pro-caspase 8 demonstrated. Panel b. HEPG2 cells were plated on glass slides and transfected with a non-specific scrambled control (siSCR) siRNA molecule, or molecules to knock down the expression of CD95 or FADD, according to the manufacturer’s instructions. In parallel, cells were transfected with a construct to express LC3-GFP. Cells were treated 24h after transfection with vehicle (DMSO) or with sorafenib (3.0 μM) and vorinostat (500 nM). Twenty four hours after drug exposure, cells were visualized at 40X using an Axiovert 200 fluorescent microscope under fluorescent light on the Zeiss Axiovert 200 microscope using the FITC filter. The mean number of autophagic vesicles per cell from random fields of 40 cells were counted (± SEM, n = 3). Panel c. Left blotting section: HEPG2 cells were transfected to express dominant negative PERK or to knock down expression of FADD. Cells were treated 24h after transfection with vehicle (DMSO), sorafenib (3.0 μM), vorinostat (500 nM) or both sorafenib and vorinostat. Six hours after drug exposure, cells were isolated CD95 was immunoprecipitated and the formation of a DISC complex containing pro-caspase 8 demonstrated. The association of other proteins: BiP/Grp78 and ATG5 was determined. The cytosolic fraction was analyzed for GAPDH expression (n = 2). Right blotting section: HEPG2 cells were transfected with either MYC-tagged wild type PERK or MYC-tagged dominant negative PERK. Cells were treated 24h after transfection with vehicle (DMSO) or with sorafenib (3.0 μM) and vorinostat (500 nM). Six hours after drug exposure, cells were isolated, CD95 was immunoprecipitated and the association of PERK proteins with CD95 determined by immunoblotting the MYC tag using an anti-Myc 9E10 antibody (a representative study, n = 2 is shown). Panel d. HEPG2 cells were plated on glass slides and infected with a recombinant adenovirus to express c-FLIP-s. In parallel, cells were transfected with a construct to express LC3-GFP. Cells were treated 24h after transfection with vehicle (DMSO) or with sorafenib (3.0 μM) and vorinostat (500 nM). Twenty four hours after drug exposure, cells were visualized at 40X using an Axiovert 200 fluorescent microscope under fluorescent light on the Zeiss Axiovert 200 microscope using the FITC filter. The mean number of autophagic vesicles per cell from random fields of 40 cells were counted (± SEM, n = 2).
Figure 5
Figure 5. Sorafenib and vorinostat -induced activation of CD95 is acidic sphingomyelinase dependent
Panel a. HEPG2 cells were plated on glass slides and were transfected with as siRNA to knock down acidic sphingomyelinase expression (siASMase). Cells were treated 24h after plating with vehicle (DMSO) or with sorafenib (3.0 μM) and vorinostat (500 nM). Six hours after drug exposure, cells were fixed in situ. Fixed cells were blocked then incubated with an anti-CD95 antibody. Cells were then incubated with a 488nm-tagged fluorescent secondary antibody. Cells were analyzed on a fluorescent microscope (X100 magnification). The intensity of CD95 staining was determined at 50 random points per cell for a total of 5 cells ± SEM (n = 3 separate studies). Panel b. Primary mouse hepatocytes were isolated as described in reference (11) and were plated on collage type I coated glass slides. Cells were cultured for 24h after isolation followed by treatment with vehicle (VEH, DMSO) or with sorafenib (3.0 μM) and vorinostat (500 nM). Six hours after drug exposure, cells were fixed in situ. Fixed cells were blocked then incubated with an anti-CD95 antibody. Cells were then incubated with a 488nm-tagged fluorescent secondary antibody. Cells were analyzed on a fluorescent microscope (X100 magnification). The intensity of CD95 staining was determined at 50 random points per cell for a total of 5 cells ± SEM (n = 2 separate studies). Panel c. In parallel to the transfection (siSCR and siASMase); de novo pathway drug inhibitor siSCR transfection plus (VEH and myriosin; Myr., 10 μM); or inhibition of both pathways simultaneously, as indicated, for the treatments used cells in Panels A and B, cells were incubated for 48h after vehicle (VEH, DMSO) or with sorafenib (3.0 μM) and vorinostat (500 nM). Forty eight hours after drug exposure cells were isolated and cell viability determined by TUNEL assay (± SEM, n = 2 independent assays). Panel d. Putative mechanisms of vorinostat and sorafenib action in epithelial tumor cells. Vorinostat and sorafenib increase ceramide levels. Ceramide permits CD95 plasma membrane localization and activation. CD95 activation leads to the induction of at least three immediate downstream survival regulatory signals: activation of pro-caspase 8 (death); activation of PERK-eIF2α-ER stress (death); activation of PERK-ATG5-autophagy (survival). Over-expression of c-FLIP-s forces the CD95 signal away from cell killing towards increased autophagy (survival). Knock down of ATG5 forces the CD95 signal away from autophagy and towards increased cell killing (caspase 8 cleavage).

Comment in

Similar articles

Cited by

References

    1. Parkin DM, Bray F, Ferlay J, Pisani P. Global cancer statistics, 2002. CA Cancer J Clin. 2005;55:74–108. - PubMed
    1. Tsao H. Management of Cutaneous Melanoma. N Engl J Med. 2004;351:998–1012. - PubMed
    1. Dent P. In: MAP kinase pathways in the control of hepatocyte growth, metabolism and survival. Dufour JF, Clavien P-A, editors. Signaling Pathways in Liver Diseases, Springer Press; 2005. pp. 223–238. Chapter 19.
    1. Dent P, Yacoub A, Fisher PB, Hagan MP, Grant S. MAPK pathways in radiation responses. Oncogene. 2003;22:5885–96. - PubMed
    1. Valerie K, Yacoub A, Hagan MP, et al. Radiation-induced cell signaling: inside-out and outside-in. Mol Cancer Ther. 2007;6:789–801. - PubMed

Publication types

MeSH terms

  NODES
admin 15
Association 24
Note 1
twitter 2