. 2008 Oct;118(10):3331-42.
doi: 10.1172/JCI35875.

Hedgehog signaling regulates epithelial-mesenchymal transition during biliary fibrosis in rodents and humans

Affiliations

Hedgehog signaling regulates epithelial-mesenchymal transition during biliary fibrosis in rodents and humans

Alessia Omenetti et al. J Clin Invest. 2008 Oct.

Abstract

Epithelial-mesenchymal transitions (EMTs) play an important role in tissue construction during embryogenesis, and evidence suggests that this process may also help to remodel some adult tissues after injury. Activation of the hedgehog (Hh) signaling pathway regulates EMT during development. This pathway is also induced by chronic biliary injury, a condition in which EMT has been suggested to have a role. We evaluated the hypothesis that Hh signaling promotes EMT in adult bile ductular cells (cholangiocytes). In liver sections from patients with chronic biliary injury and in primary cholangiocytes isolated from rats that had undergone bile duct ligation (BDL), an experimental model of biliary fibrosis, EMT was localized to cholangiocytes with Hh pathway activity. Relief of ductal obstruction in BDL rats reduced Hh pathway activity, EMT, and biliary fibrosis. In mouse cholangiocytes, coculture with myofibroblastic hepatic stellate cells, a source of soluble Hh ligands, promoted EMT and cell migration. Addition of Hh-neutralizing antibodies to cocultures blocked these effects. Finally, we found that EMT responses to BDL were enhanced in patched-deficient mice, which display excessive activation of the Hh pathway. Together, these data suggest that activation of Hh signaling promotes EMT and contributes to the evolution of biliary fibrosis during chronic cholestasis.


Figures
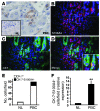
Figure 1
Figure 1. Bile ductular cells express the EMT marker S100A4 in patients with PBC.
S100A4 immunostaining in representative sections from control subjects (NL) undergoing resection of metastases from colorectal cancer (A, inset) and patients with PBC (A). Immunostaining of PBC livers for S100A4 (B) and epithelial CK-7 (C) demonstrated colocalization of both markers in rare ductular cells (D). Ductular appearing cells that expressed CK-7 without or with S100A4 were counted in 20 fields at ×20 magnification in all controls and patients. Data are displayed as mean numbers of CK-7/S100A4 double-positive cells relative to numbers of CK-7 single-positive cells per field (E) and mean fold differences in numbers of CK7/S100A4 double-positive cells in PBC patients versus controls (F). **P < 0.005. Original magnification, ×100 (A), ×20 (A, inset), ×40 (BD), ×100 (D, inset).
Figure 2
Figure 2. EMT markers are upregulated in rat cholangiocytes when biliary fibrosis is induced by BDL.
(A) QRT-PCR analysis of whole liver mRNA expression of S100a4 in rats with BDL-induced biliary fibrosis (n = 8) and BDL rats treated with R-Y to alleviate biliary obstruction and reverse biliary fibrosis (n = 5 per each time point). Results were compared with those in sham-operated rats (n = 4) and displayed as mean ± SEM. *P < 0.05 versus sham control. (BE) QRT-PCR analysis of mRNA from freshly isolated primary cholangiocytes from rats 1 week after BDL. (B) S100a4; (C) Aqp1; (D) CK19; and (E) CK-7. Results are compared with similar mRNA analysis of freshly isolated cholangiocytes from sham-operated controls. Data are representative of 3 independent experiments and shown as mean ± SEM. *P < 0.05, **P < 0.005 versus sham control.
Figure 3
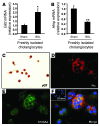
Figure 3. Cholangiocyte populations undergoing EMT during biliary fibrosis in rats are Hh responsive.
(A and B) QRT-PCR analysis of the Hh-inducible transcription factor Gli2 (A) and Hh ligand inhibitor Hhip (B) in primary cholangiocytes isolated from 1-week BDL rats or sham-operated controls (n = 3). Data are shown as mean ± SEM. *P < 0.05, **P < 0.005 versus sham-operated controls. Immunohistochemistry showing γ glutamyl transpeptidase (γGT) staining in primary cholangiocytes from BDL rats (C) and expression of Ptc (D) and S100A4 (E) in the same preparation. Merged images of S100A4/Ptc in cholangiocytes from BDL rats (F) and sham-operated controls (F, inset). Original magnification, ×20 (C), ×100 (DF), ×20 (F, inset).
Figure 4
Figure 4. Cholangiocyte populations undergoing EMT during biliary fibrosis in humans are Hh responsive.
Gli2 (brown) localized in nuclei of ductular cells expressing S100A4 (A), vimentin (B), and CK-7 (C) in representative liver sections from PBC patients. Positivity for S100A4, vimentin, or CK-7 is shown as blue cytoplasmic staining. Original magnification, ×100 (AC).
Figure 5
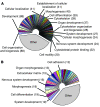
Figure 5. Soluble factors released by myofibroblasts change the gene expression profile of cocultured cholangiocytes.
(A and B) GO analysis of microarray data from cholangiocytes cocultured with MF-HSCs, compared with cholangiocyte monocultures. Each gene probe having an expression ratio above 1.500 and below 0.666 was then assigned to its corresponding GO families. GO sets were therefore ranked based on the total number of genes belonging to them. GO families associated with more than 10% of selected genes were discarded, in order to increase the specificity of the GO analysis. This subpopulation of GO sets was further split into 2 groups, one accounting for at least 60% of this subpopulation, and the other one accounting for the remaining percentage (<40%). A pie chart was then generated using individual names for the first group of GO families, while GO sets belonging to the second group were collectively designated as “other.” (A) Upregulated GO gene sets. (B) Downregulated GO gene sets. Numbers in parenthesis represent altered genes belonging to that specific family. Original pie charts and legends are provided as Supplemental Figures 1 and 2. Complete lists of GO families and EASE scores are reported in Tables 1 and 2 and Supplemental Table 2.
Figure 6
Figure 6. EMT gene profile is induced in cholangiocytes by coculture with myofibroblasts.
(A and B) Microarray probe analysis. The probe expression values of available Affymetrix GeneChips were calculated by means of the Robust Multichip Average (RMA) algorithm, based on the Affymetrix CEL and CDF files as standard inputs. Gene probes having an expression ratio above 1.500 (upper threshold) and below 0.666 (i.e., the reciprocal of 1.500; lower threshold) were considered for analysis. (A) Upregulation of Igf1r, an EMT signal transducer; Hmga2, an EMT transcriptional regulator; SMAD-specific E3 ubiquitin protein ligase 1 (Smurf1, a TGF-β signaling effector); and cysteine-rich transmembrane BMP regulator 1 (Crim1), with significant downregulation of Bmp7, an EMT antagonist. (B) Probe analysis revealed the acquisition of mesenchymal phenotype in cocultured cholangiocytes, with loss of epithelial markers (white bars) such as desmoplakin and upregulation of mesenchymal markers (black bars) such as laminin β3, fibronectin, filamin, N-cadherin, and S100a4. Complete probe analysis is provided in Supplemental Table 1. (C) Microarray data validation by QRT-PCR analysis. _target gene mRNA levels in cocultured cholangiocytes are displayed as fold change relative to monocultures. Data are representative of 3 independent experiments and shown as mean ± SEM. *P < 0.05, **P < 0.005 versus monoculture.
Figure 7
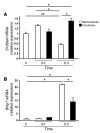
Figure 7. Coculture with MF-HSCs reverses cholangiocytes’ tendency to retain epithelial gene expression.
Cholangiocytes were cultured alone (monoculture, white bars) or with MF-HSCs (coculture, black bars) and harvested after 3 or 6 days. QRT-PCR analysis was done to assess expression of S100a4 (A) and Bmp7 (B). Results were compared with expression of these genes in freshly plated cholangiocytes (time 0). Data are mean ± SEM of 3 experiments. *P < 0.05 and **P < 0.005.
Figure 8
Figure 8. Myofibroblast-derived soluble factors increase motility/migration in cocultured cholangiocytes.
(AF) Cell migration was assessed by wound-healing assay. Cholangiocytes were cultured in the absence (A and B) or presence (CF) of Transwell filter inserts containing MF-HSCs for 6 days; cholangiocyte monolayers were then scratched, and an image was acquired immediately (time 0; A, C, and E) and 18 hours later after treatment with control IgG (B, D, and black bars) or Hh-neutralizing antibody (NAb) (F and gray bars). Cholangiocyte migration was quantified by measuring the distance dividing the 2 sides of the monolayer using Image J software (G) and by counting the numbers of cells that had migrated into the wound after 18 hours (H). **P < 0.005 versus monocultures, time 0 (G) or IgG-treated monoculture (H); #P < 0.005 versus IgG-treated coculture. Original magnification, ×10 (AF). The dashed lines (AF) indicate the leading edge of the cut that was made across the monolayers.
Figure 9
Figure 9. Neutralization of myofibroblast-derived Hh ligands inhibits EMT gene expression profile in cocultured cholangiocytes.
Cells of the MF-HSC 8B line were cultured alone for 6 days and conditioned medium was collected. After 18 hours of serum starvation, monocultures of cholangiocyte cell line 603B were treated for an additional 24 hours with MF-HSC–conditioned medium (MF-conditioned medium) in the presence of control IgG (10 μg/ml; black bars) or Hh-neutralizing antibody (10 μg/ml; gray bars). Control cholangiocyte monocultures received regular (not MF-HSC–conditioned) medium (white bars). QRT-PCR was then performed to analyze the expression of EMT-related genes (A) and cell markers (B) that had been altered by cocultures with MF-HSCs. Results are expressed relative to the control cholangiocytes that received unconditioned medium. Data are representative of 3 independent experiments and expressed as mean ± SEM. *P < 0.05 versus control cholangiocytes; #P < 0.05 versus cholangiocytes treated with MF-HSC–conditioned medium plus IgG.
Figure 10
Figure 10. Ptc mice with increased Hh activity exhibit increased EMT after BDL.
Liver sections stained with H&E (A and B) or anti-CK (C and D) in representative WT mice (A and C) and Ptc mice (B and D) after 1-week BDL. QRT-PCR of whole liver tissue from Ptc mice (n = 6) and their WT littermates (n = 6) after 1 week of BDL. (E) Vimentin; (F) collagen 1α(I); (G) Tgfb1; (H) Hmga2; (I) Bmp7. Data are shown as mean ± SEM. *P < 0.05 versus WT-BDL; **P < 0.005, P = 0.08 versus WT-BDL. Original magnification: ×20 (A and B), ×40 (C and D).

Comment in

Similar articles

Cited by

References

    1. Lazaridis K.N., Strazzabosco M., Larusso N.F. The cholangiopathies: disorders of biliary epithelia. Gastroenterology. 2004;127:1565–1577. doi: 10.1053/j.gastro.2004.08.006. - DOI - PubMed
    1. Kisseleva T., Brenner D.A. Mechanisms of fibrogenesis. Exp. Biol. Med. (Maywood). 2008;233:109–122. doi: 10.3181/0707-MR-190. - DOI - PubMed
    1. Bataller R., Brenner D.A. Liver fibrosis. J. Clin. Invest. 2005;115:209–218. - PMC - PubMed
    1. Milani S., et al. Procollagen expression by nonparenchymal rat liver cells in experimental biliary fibrosis. Gastroenterology. 1990;98:175–184. - PubMed
    1. Kinnman N., et al. The myofibroblastic conversion of peribiliary fibrogenic cells distinct from hepatic stellate cells is stimulated by platelet-derived growth factor during liver fibrogenesis. Lab. Invest. 2003;83:163–173. - PubMed

Publication types

MeSH terms

  NODES
Association 1
twitter 2