Spatial analysis of malaria in Anhui province, China
- PMID: 18847489
- PMCID: PMC2572066
- DOI: 10.1186/1475-2875-7-206
Spatial analysis of malaria in Anhui province, China
Abstract
Background: Malaria has re-emerged in Anhui Province, China, and this province was the most seriously affected by malaria during 2005-2006. It is necessary to understand the spatial distribution of malaria cases and to identify highly endemic areas for future public health planning and resource allocation in Anhui Province.
Methods: The annual average incidence at the county level was calculated using malaria cases reported between 2000 and 2006 in Anhui Province. GIS-based spatial analyses were conducted to detect spatial distribution and clustering of malaria incidence at the county level.
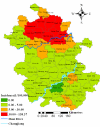
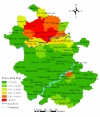
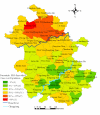
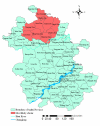
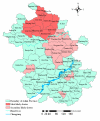
Results: The spatial distribution of malaria cases in Anhui Province from 2000 to 2006 was mapped at the county level to show crude incidence, excess hazard and spatial smoothed incidence. Spatial cluster analysis suggested 10 and 24 counties were at increased risk for malaria (P < 0.001) with the maximum spatial cluster sizes at < 50% and < 25% of the total population, respectively.
Conclusion: The application of GIS, together with spatial statistical techniques, provide a means to quantify explicit malaria risks and to further identify environmental factors responsible for the re-emerged malaria risks. Future public health planning and resource allocation in Anhui Province should be focused on the maximum spatial cluster region.
Figures
Similar articles
-
Analysis of the geographic distribution of HFRS in Liaoning Province between 2000 and 2005.BMC Public Health. 2007 Aug 15;7:207. doi: 10.1186/1471-2458-7-207. BMC Public Health. 2007. PMID: 17697362 Free PMC article.
-
Spatial analysis of hemorrhagic fever with renal syndrome in China.BMC Infect Dis. 2006 Apr 26;6:77. doi: 10.1186/1471-2334-6-77. BMC Infect Dis. 2006. PMID: 16638156 Free PMC article.
-
Spatial, temporal, and spatiotemporal analysis of malaria in Hubei Province, China from 2004-2011.Malar J. 2015 Apr 8;14:145. doi: 10.1186/s12936-015-0650-2. Malar J. 2015. PMID: 25879447 Free PMC article.
-
Spatio-temporal analysis of malaria incidence at the village level in a malaria-endemic area in Hainan, China.Malar J. 2011 Apr 14;10:88. doi: 10.1186/1475-2875-10-88. Malar J. 2011. PMID: 21492475 Free PMC article.
-
Spatial analysis of dengue fever in Guangdong Province, China, 2001-2006.Asia Pac J Public Health. 2014 Jan;26(1):58-66. doi: 10.1177/1010539512472356. Epub 2013 Jan 22. Asia Pac J Public Health. 2014. PMID: 23343642
Cited by
-
The abundance and host-seeking behavior of culicine species (Diptera: Culicidae) and Anopheles sinensis in Yongcheng city, People's Republic of China.Parasit Vectors. 2011 Nov 24;4:221. doi: 10.1186/1756-3305-4-221. Parasit Vectors. 2011. PMID: 22115320 Free PMC article.
-
Spatiotemporal Clustering Analysis and Risk Assessments of Human Cutaneous Anthrax in China, 2005-2012.PLoS One. 2015 Jul 24;10(7):e0133736. doi: 10.1371/journal.pone.0133736. eCollection 2015. PLoS One. 2015. PMID: 26208355 Free PMC article.
-
The temporal lagged association between meteorological factors and malaria in 30 counties in south-west China: a multilevel distributed lag non-linear analysis.Malar J. 2014 Feb 15;13:57. doi: 10.1186/1475-2875-13-57. Malar J. 2014. PMID: 24528891 Free PMC article.
-
Adaptation of a visualized loop-mediated isothermal amplification technique for field detection of Plasmodium vivax infection.Parasit Vectors. 2011 Jun 21;4:115. doi: 10.1186/1756-3305-4-115. Parasit Vectors. 2011. PMID: 21693031 Free PMC article.
-
Genetic diversity of Plasmodium vivax population in Anhui province of China.Malar J. 2014 Jan 8;13:13. doi: 10.1186/1475-2875-13-13. Malar J. 2014. PMID: 24401153 Free PMC article.
References
-
- World Health Organization Expert Committee on Malaria: 20th Report. World Health Organ Tech Rep. 2000. p. 735. - PubMed
-
- Breman JG, Alilio MS, Mills A. Conquering the intolerable burden of malaria: what's new, what's needed: a summary. Am J Trop Med Hyg. 2004;71:1–15. - PubMed
-
- Tang LH. Progress in malaria control in China. Chin Med J. 2000;113:89–92. - PubMed
Publication types
MeSH terms
LinkOut - more resources
Full Text Sources
Medical

