. 2009 Mar 20;284(12):7446-54.
doi: 10.1074/jbc.M806209200. Epub 2009 Jan 15.

The non-coding RNA gadd7 is a regulator of lipid-induced oxidative and endoplasmic reticulum stress

Affiliations

The non-coding RNA gadd7 is a regulator of lipid-induced oxidative and endoplasmic reticulum stress

Rita T Brookheart et al. J Biol Chem. .

Abstract

In obesity and diabetes, an imbalance in fatty acid uptake and fatty acid utilization leads to excess accumulation of lipid in non-adipose tissues. This lipid overload is associated with cellular dysfunction and cell death, which contribute to organ failure, a phenomenon termed lipotoxicity. To elucidate the molecular mechanism of lipid-mediated cell death, we generated and characterized a mutant Chinese hamster ovary cell line that is resistant to palmitate-induced cell death. In this mutant, random insertion of a retroviral promoter trap has disrupted the gene for the non-coding RNA, growth arrested DNA-damage inducible gene 7 (gadd7). Here we report that gadd7 is induced by lipotoxic stress in a reactive oxygen species (ROS)-dependent fashion and is necessary for both lipid- and general oxidative stress-mediated cell death. Depletion of gadd7 by mutagenesis or short hairpin RNA knockdown significantly reduces lipid and non-lipid induced ROS. Furthermore, depletion of gadd7 delays and diminishes ROS-induced endoplasmic reticulum stress. Together these data are the first to implicate a non-coding RNA in a feed-forward loop with oxidative stress and its induction of the endoplasmic reticulum stress response.


Figures

FIGURE 1.
FIGURE 1.
Mutant 2E1 is resistant to palmitate-induced cell death and apoptosis. WT and 2E1 mutant cells were incubated with 500 μm palmitate (Palm) for 48 h or 80 nm staurosporine (Staur) and 2 μm actinomycin D (Act D) for 24 h. Cell death was assessed by PI staining and flow cytometry (A) and apoptosis was assessed by TUNEL and flow cytometry (B). Data are expressed as mean ± S.E. for three independent experiments. *, p < 0.005 for 2E1 versus WT. C, autoradiogram shows Southern blot analysis of WT (lanes 1–3) and 2E1 mutant (lanes 4–6) genomic DNA digested with restriction enzymes BglII, NcoI, or XbaI, each of which cuts once within the integrated ROSAβgeo provirus. The blot was probed with a 32P-labeled fragment corresponding to the ROSAβgeo sequence.
FIGURE 2.
FIGURE 2.
Disruption of one gadd7 allele in 2E1 cells leads to decreased gadd7 RNA expression. A, schematic representation of gadd7-retroviral fusion transcript with 5′ RACE primer location and endogenous gadd7 transcript. B, directed PCR was performed on cDNA from WT (lanes 1 and 2) and 2E1 (lanes 3 and 4) cells to detect gadd7 expression (lanes 1 and 3) and fusion transcript (lanes 2 and 4). Negative control reactions (lanes 5 and 6) contained no cDNA. Forward (F) and reverse (R) primers for gadd7 were used in PCR for lanes 1, 3, and 5. Forward gadd7 primer and reverse primer for the proviral sequence (ROSAβgeo) were used in PCR for lanes 2, 4, and 6. C, basal gadd7 RNA expression in WT and 2E1 mutant cells was determined by qPCR and normalized to β-actin RNA expression. *, p < 0.05 for 2E1 versus WT. Data are expressed as mean ± S.E. for three independent experiments. D, WT and 2E1 mutant cells were treated with 500 μm palmitate for the indicated times and gadd7 expression was determined by qPCR and normalized to β-actin RNA expression. *, p < 0.05 for 2E1 versus WT; #, p < 0.01 for treated versus untreated WT cells and for treated 2E1 versus treated WT. Data are expressed as mean ± S.E. for three independent experiments.
FIGURE 3.
FIGURE 3.
gadd7 ORFs are not translated. A, schematic representation of gadd7 RNA transcript with three predicted ORFs. B, WT cells were co-transfected with the indicated plasmids and GFP. GFP (left column of images) and epitope-tagged proteins (right column) were detected by immunofluorescence. Images shown are representative of three independent experiments. Bar, 60 μm. C, graph shows percentage of transfected (GFP-positive) cells expressing Myc. Data are mean ± S.E. values from analysis of 200 transfected cells in each of three experiments. *, p < 0.001 ORF-Myc-transfected cells versus NPC2-Myc-transfected cells.
FIGURE 4.
FIGURE 4.
gadd7 knockdown recapitulates palmitate-resistant phenotype. Stable cell lines were generated following transfection with a scrambled (SCR) or gadd7 _targeting shRNA (KD1 and KD2). A, gadd7 RNA expression was determined by qPCR and normalized to β-actin RNA expression under normal growth conditions (basal) and following treatment with 500 μm palmitate for 10 h (lipotoxic). B, cells were treated with 500 μm palmitate for 48 h and cell death was assessed by PI staining and flow cytometry. All data are expressed as mean ± S.E. for three independent experiments. *, p < 0.05 for KD versus SCR.
FIGURE 5.
FIGURE 5.
Palmitate-induced ROS generation occurs prior to gadd7 induction. WT cells were treated with 500μm palmitate for the indicated time course and ROS generation was quantified by CM-H2DCFDA labeling and flow cytometry. gadd7 expression was determined by qPCR normalized to β-actin RNA expression. All data are expressed as mean ± S.E. for three independent experiments. *, p < 0.001 palmitate-treated versus untreated.
FIGURE 6.
FIGURE 6.
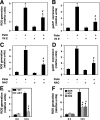
gadd7 is a regulator of palmitate-induced ROS generation. A, WT cells were treated with 500 μm palmitate in the presence or absence of vitamin E (Vit E) for 12 h. ROS generation was quantified by CM-H2DCFDA labeling and flow cytometry. *, p < 0.001 palmitate (Palm)-treated versus untreated; #, p < 0.01 Vit E/palmitate-treated versus Vit E-treated; ‡, p < 0.05 Vit E/palmitate-treated versus palmitate-treated cells. B, WT cells were treated as in A, and gadd7 expression was determined by qPCR normalized to β-actin RNA expression. *, p < 0.001 palmitate-treated versus untreated; #, p < 0.05 Vit E/palmitate-treated versus Vit E-treated; ‡, p < 0.005 for Vit E/palm-treated versus palmitate-treated cells. C, WT cells were treated with 500μm palmitate in the presence or absence of NAC for 12 h. ROS generation was quantified as in A.*, p < 0.001 palmitate-treated versus untreated; #, p < 0.001 NAC/palmitate-treated versus NAC-treated; ‡, p < 0.05 NAC/palmitate-treated versus palmitate-treated cells. D, WT cells were treated as in C, and gadd7 expression was determined by qPCR as in B.*, p < 0.001 palmitate-treated versus untreated; #, p < 0.001 NAC/palmitate-treated versus NAC-treated; ‡, p < 0.001 for NAC/palmitate-treated versus palmitate-treated cells. E,WTand 2E1 cells were treated with palmitate and analyzed for ROS generation as in A.*, p < 0.05 for treated versus untreated mutant cells; #, p < 0.001 for treated mutant versus treated WT cells. F, stable scrambled (SCR) and gadd7 knockdown (KD1 and KD2) cell lines were treated with palmitate and analyzed for ROS generation as in A.*, p < 0.001 for treated versus untreated knockdown cells; #, p < 0.005 for treated knockdown versus treated SCR cells. All data are expressed as mean ± S.E. for three independent experiments.
FIGURE 7.
FIGURE 7.
gadd7 is necessary for palmitate-induced ER stress. WT and 2E1 cells were incubated with 500 μm palmitate, 1 μm thapsigargin (Tg), or 2.5 μg/ml tunicamycin (Tm) for the indicated times. A, cDNA was synthesized and used for PCR with primers specific for the region of xbp-1 that is spliced during ER stress induction. PCR products were separated by non-denaturing PAGE, followed by EtBr staining. Gel shown is representative of three independent experiments, with arrows indicating xbp-1 unspliced (u) and spliced (s) species. B, Grp78 RNA expression in WT and 2E1 mutant cells was determined by qPCR and is reported normalized to β-actin RNA expression. Data are expressed as mean ± S.E. for three independent experiments, *, p < 0.01 palmitate-treated 2E1 versus treated WT. n.s., not significant. C, cell lysates were analyzed by Western blot probed for CHOP and β-actin proteins. Blots shown are representative of three independent experiments. Graph shows quantification of CHOP expression normalized toβ-actin. Data are expressed as mean ± S.E. for three independent experiments, *, p < 0.05 for 2E1 versus WT. D, cell lysates were analyzed by Western blot probed for phosphorylated (P-JNK) and total (T-JNK) JNK proteins. A representative blot is shown. Graph shows quantification of phosphorylated JNK1 and JNK2 normalized to total JNK1 and JNK2, respectively. Data are expressed as mean ± S.E. for three independent experiments, *, p < 0.05 for 2E1 versus WT.
FIGURE 8.
FIGURE 8.
gadd7 regulates general ROS amplification. A, WT cells were treated with 1 mm H2O2 or 100 μm xanthine and 150 microunits/ml xanthine oxidase (X:XO) for 4 h. gadd7 expression was determined by qPCR and is reported normalized to β-actin RNA expression. All data are expressed as mean ± S.E. for a minimum of 6 measures per condition. *, p < 0.005 for treated versus untreated cells. B, WT and 2E1 cells were treated with 2.3 mm H2O2 or 100 μm xanthine and 15 microunits/ml xanthine oxidase for 30 min or 2 h, respectively. Generation of ROS was measured by CM-H2DCFDA labeling and flow cytometry. All data are expressed as mean ± S.E. for three independent experiments. *, p < 0.05 for treated 2E1 versus treated WT.
FIGURE 9.
FIGURE 9.
gadd7 is necessary for ROS-induced ER stress and cell death. A, WT and 2E1 cells were treated with 2.3 mm H2O2. Nuclear cell lysates were analyzed by Western blot for CHOP and proliferating cell nuclear antigen proteins. Blots shown are representative of three independent experiments. B, cells were treated as in A for 24 h. Cell death was assessed by PI staining and flow cytometry. All data are expressed as mean ± S.E. for three independent experiments. *, p < 0.001 for treated 2E1 versus treated WT.
FIGURE 10.
FIGURE 10.
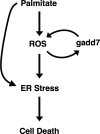
Model of the role of gadd7 in the lipotoxic response. Excess palmitate leads to generation of ROS, which in turn activates the ER stress response. Palmitate may also act directly on the ER through remodeling of ER membrane lipids (28). Oxidative stress generated by palmitate induces expression of gadd7, which plays a role in amplifying oxidative stress and in turning on the ER stress response following oxidative stress. Oxidative stress, ER stress, and induction of gadd7 all contribute to palmitate-induced cell death.

Similar articles

Cited by

References

    1. Nollen, E. A., and Morimoto, R. I. (2002) J. Cell Sci. 115 2809–2816 - PubMed
    1. Zhang, K., and Kaufman, R. J. (2004) J. Biol. Chem. 279 25935–25938 - PubMed
    1. Unger, R. H. (2002) Annu. Rev. Med. 53 319–336 - PubMed
    1. Leichman, J. G., Aguilar, D., King, T. M., Vlada, A., Reyes, M., and Taegtmeyer, H. (2006) Am. J. Clin. Nutr. 84 336–341 - PubMed
    1. Sharma, S., Adrogue, J. V., Golfman, L., Uray, I., Lemm, J., Youker, K., Noon, G. P., Frazier, O. H., and Taegtmeyer, H. (2004) FASEB J. 18 1692–1700 - PubMed

Publication types

MeSH terms

LinkOut - more resources

  NODES
INTERN 2
twitter 2