The contribution of psychosocial stress to the obesity epidemic: an evolutionary approach
- PMID: 19156597
- PMCID: PMC2703181
- DOI: 10.1055/s-0028-1119377
The contribution of psychosocial stress to the obesity epidemic: an evolutionary approach
Erratum in
- Horm Metab Res. 2009 Apr;41(4):270
Abstract
The Thrifty Gene hypothesis theorizes that during evolution a set of genes has been selected to ensure survival in environments with limited food supply and marked seasonality. Contemporary environments have predictable and unlimited food availability, an attenuated seasonality due to artificial lighting, indoor heating during the winter and air conditioning during the summer, and promote sedentariness and overeating. In this setting the thrifty genes are constantly activated to enhance energy storage. Psychosocial stress and sleep deprivation are other features of modern societies. Stress-induced hypercortisolemia in the setting of unlimited food supply promotes adiposity. Modern man is becoming obese because these ancient mechanisms are efficiently promoting a positive energy balance. We propose that in today's plentifully provisioned societies, where sedentariness and mental stress have become typical traits, chronic activation of the neuroendocrine systems may contribute to the increased prevalence of obesity. We suggest that some of the yet unidentified thrifty genes may be linked to highly conserved energy sensing mechanisms (AMP kinase, mTOR kinase). These hypotheses are testable. Rural societies that are becoming rapidly industrialized and are witnessing a dramatic increase in obesity may provide a historical opportunity to conduct epidemiological studies of the thrifty genotype. In experimental settings, the effects of various forms of psychosocial stress in increasing metabolic efficiency and gene expression can be further tested.
Figures
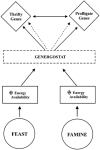
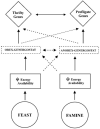
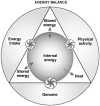
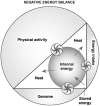
 Fig. 3. The size of the arrows of the wheels is proportional to the effect and the direction of the arrows indicates the movement of the energy fluxes. Wheels represent the regulatory interactions between the three components (genome, physical activity, energy intake) and the mechanisms controlling the internal energy.
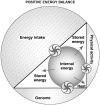
 Fig. 3. The size of the arrows of the wheels is proportional to the effect and the direction of the arrows indicates the movement of the energy fluxes. Wheels represent the regulatory interactions between the three components (genome, physical activity, energy intake) and the mechanisms controlling the internal energy.
 Fig. 3. Double arrows (↔) indicate reciprocal influences. Wheels are non-energetic, regulatory interactions between the three components (genome, physical activity, energy intake) and the mechanisms controlling the internal energy.
Similar articles
-
Evolutionary perspectives on the obesity epidemic: adaptive, maladaptive, and neutral viewpoints.Annu Rev Nutr. 2013;33:289-317. doi: 10.1146/annurev-nutr-071811-150711. Annu Rev Nutr. 2013. PMID: 23862645 Review.
-
On the evolutionary origins of obesity: a new hypothesis.Endocrinology. 2014 May;155(5):1573-88. doi: 10.1210/en.2013-2103. Epub 2014 Feb 26. Endocrinology. 2014. PMID: 24605831 Review.
-
Revisiting the evolutionary origins of obesity: lazy versus peppy-thrifty genotype hypothesis.Obes Rev. 2018 Nov;19(11):1525-1543. doi: 10.1111/obr.12742. Epub 2018 Sep 27. Obes Rev. 2018. PMID: 30261552 Review.
-
Do thrifty genes exist? Revisiting uricase.Obesity (Silver Spring). 2022 Oct;30(10):1917-1926. doi: 10.1002/oby.23540. Obesity (Silver Spring). 2022. PMID: 36150210 Free PMC article. Review.
-
The evolution of body fatness: trading off disease and predation risk.J Exp Biol. 2018 Mar 7;221(Pt Suppl 1):jeb167254. doi: 10.1242/jeb.167254. J Exp Biol. 2018. PMID: 29514887
Cited by
-
The future of human malnutrition: rebalancing agency for better nutritional health.Global Health. 2021 Oct 9;17(1):119. doi: 10.1186/s12992-021-00767-4. Global Health. 2021. PMID: 34627303 Free PMC article. Review.
-
A longitudinal analysis of maternal depressive symptoms and children's food consumption and weight outcomes.Public Health Nutr. 2014 Dec;17(12):2759-68. doi: 10.1017/S1368980013003376. Epub 2014 Jan 6. Public Health Nutr. 2014. PMID: 24476574 Free PMC article.
-
The evolution of human adiposity and obesity: where did it all go wrong?Dis Model Mech. 2012 Sep;5(5):595-607. doi: 10.1242/dmm.009613. Dis Model Mech. 2012. PMID: 22915021 Free PMC article. Review.
-
Health-chair reform: your chair: comfortable but deadly.Diabetes. 2010 Nov;59(11):2715-6. doi: 10.2337/db10-1042. Diabetes. 2010. PMID: 20980469 Free PMC article. No abstract available.
-
Harsh parenting, physical health, and the protective role of positive parent-adolescent relationships.Soc Sci Med. 2016 May;157:18-26. doi: 10.1016/j.socscimed.2016.03.027. Epub 2016 Mar 21. Soc Sci Med. 2016. PMID: 27060538 Free PMC article.
References
-
- Last J. A Dictionary of Epidemiology. 4th ed. Oxford University Press; Oxford: 2001.
-
- Kac G. Secular height trend: a literature review. Cad Saude Publica. 1999;15:451–461. - PubMed
-
- Wattigney WA, Srinivasan SR, Chen W, Greenlund KJ, Berenson GS. Secular trend of earlier onset of menarche with increasing obesity in black and white girls: the Bogalusa Heart Study. Ethn Dis. 1999;9:181–189. - PubMed
-
- Lynn Matton ND, Wijndaele K, Philippaerts R, Duquet W, Beunen G, Claessens AL, Thomis M, Lefevre J. Secular trends in anthropometric characteristics, physical fitness, physical activity, and biological maturation in Flemish adolescents between 1969 and 2005. Am J Hum Biol. 2007;19:345–357. - PubMed
-
- Flegal KMCM, Kuczmarski RJ, Johnson CL. Overweight and obesity in the United States: prevalence and trends, 1960-1994. Int J Obes Relat Metab Disord. 1998;22:39–47. - PubMed
Publication types
MeSH terms
Grants and funding
LinkOut - more resources
Full Text Sources
Medical
Miscellaneous

