Development and evaluation of new mask protocols for gene expression profiling in humans and chimpanzees
- PMID: 19265541
- PMCID: PMC2660304
- DOI: 10.1186/1471-2105-10-77
Development and evaluation of new mask protocols for gene expression profiling in humans and chimpanzees
Abstract
Background: Cross-species gene expression analyses using oligonucleotide microarrays designed to evaluate a single species can provide spurious results due to mismatches between the interrogated transcriptome and arrayed probes. Based on the most recent human and chimpanzee genome assemblies, we developed updated and accessible probe masking methods that allow human Affymetrix oligonucleotide microarrays to be used for robust genome-wide expression analyses in both species. In this process, only data from oligonucleotide probes predicted to have robust hybridization sensitivity and specificity for both transcriptomes are retained for analysis.
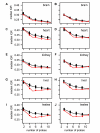
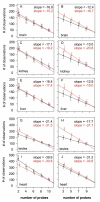
Results: To characterize the utility of this resource, we applied our mask protocols to existing expression data from brains, livers, hearts, testes, and kidneys derived from both species and determined the effects probe numbers have on expression scores of specific transcripts. In all five tissues, probe sets with decreasing numbers of probes showed non-linear trends towards increased variation in expression scores. The relationships between expression variation and probe number in brain data closely matched those observed in simulated expression data sets subjected to random probe masking. However, there is evidence that additional factors affect the observed relationships between gene expression scores and probe number in tissues such as liver and kidney. In parallel, we observed that decreasing the number of probes within probe sets lead to linear increases in both gained and lost inferences of differential cross-species expression in all five tissues, which will affect the interpretation of expression data subject to masking.
Conclusion: We introduce a readily implemented and updated resource for human and chimpanzee transcriptome analysis through a commonly used microarray platform. Based on empirical observations derived from the analysis of five distinct data sets, we provide novel guidelines for the interpretation of masked data that take the number of probes present in a given probe set into consideration. These guidelines are applicable to other customized applications that involve masking data from specific subsets of probes.
Figures


Similar articles
-
Optimized probe masking for comparative transcriptomics of closely related species.PLoS One. 2013 Nov 8;8(11):e78497. doi: 10.1371/journal.pone.0078497. eCollection 2013. PLoS One. 2013. PMID: 24260119 Free PMC article.
-
Dynamic probe selection for studying microbial transcriptome with high-density genomic tiling microarrays.BMC Bioinformatics. 2010 Feb 9;11:82. doi: 10.1186/1471-2105-11-82. BMC Bioinformatics. 2010. PMID: 20144223 Free PMC article.
-
Integrating multiple genome annotation databases improves the interpretation of microarray gene expression data.BMC Genomics. 2010 Jan 20;11:50. doi: 10.1186/1471-2164-11-50. BMC Genomics. 2010. PMID: 20089164 Free PMC article.
-
Advances in spotted microarray resources for expression profiling.Brief Funct Genomic Proteomic. 2003 Apr;2(1):21-30. doi: 10.1093/bfgp/2.1.21. Brief Funct Genomic Proteomic. 2003. PMID: 15239940 Review.
-
Recent patents and challenges on DNA microarray probe design technologies.Recent Pat DNA Gene Seq. 2010 Nov;4(3):210-7. doi: 10.2174/187221510794751640. Recent Pat DNA Gene Seq. 2010. PMID: 21121887 Review.
Cited by
-
Origin and evolution of a placental-specific microRNA family in the human genome.BMC Evol Biol. 2010 Nov 10;10:346. doi: 10.1186/1471-2148-10-346. BMC Evol Biol. 2010. PMID: 21067568 Free PMC article.
-
Derivation of induced pluripotent stem cells from orangutan skin fibroblasts.BMC Res Notes. 2015 Oct 16;8:577. doi: 10.1186/s13104-015-1567-0. BMC Res Notes. 2015. PMID: 26475477 Free PMC article.
-
'maskBAD'--a package to detect and remove Affymetrix probes with binding affinity differences.BMC Bioinformatics. 2012 Apr 16;13:56. doi: 10.1186/1471-2105-13-56. BMC Bioinformatics. 2012. PMID: 22507266 Free PMC article.
-
Identification of differences in human and great ape phytanic acid metabolism that could influence gene expression profiles and physiological functions.BMC Physiol. 2010 Oct 8;10:19. doi: 10.1186/1472-6793-10-19. BMC Physiol. 2010. PMID: 20932325 Free PMC article.
-
Human and great ape red blood cells differ in plasmalogen levels and composition.Lipids Health Dis. 2011 Jun 17;10:101. doi: 10.1186/1476-511X-10-101. Lipids Health Dis. 2011. PMID: 21679470 Free PMC article.
References
Publication types
MeSH terms
Substances
Grants and funding
- R01 GM072477-01A1/GM/NIGMS NIH HHS/United States
- R01 GM072477-02/GM/NIGMS NIH HHS/United States
- C06 CA062528/CA/NCI NIH HHS/United States
- R01 GM072477-05/GM/NIGMS NIH HHS/United States
- R01 GM072447/GM/NIGMS NIH HHS/United States
- R37 DE012711/DE/NIDCR NIH HHS/United States
- C06 RR10600-01/RR/NCRR NIH HHS/United States
- DE012711-09S1/DE/NIDCR NIH HHS/United States
- R01 DE012711/DE/NIDCR NIH HHS/United States
- R01 GM072477-04/GM/NIGMS NIH HHS/United States
- ImNIH/Intramural NIH HHS/United States
- C06 RR014514/RR/NCRR NIH HHS/United States
- GM072447/GM/NIGMS NIH HHS/United States
- CA62528-01/CA/NCI NIH HHS/United States
- R01 GM072477/GM/NIGMS NIH HHS/United States
- RR14514-01/RR/NCRR NIH HHS/United States
- R01 GM072477-03/GM/NIGMS NIH HHS/United States
LinkOut - more resources
Full Text Sources

