Identification of Atg5-dependent transcriptional changes and increases in mitochondrial mass in Atg5-deficient T lymphocytes
- PMID: 19276668
- PMCID: PMC3737142
- DOI: 10.4161/auto.5.5.8133
Identification of Atg5-dependent transcriptional changes and increases in mitochondrial mass in Atg5-deficient T lymphocytes
Abstract
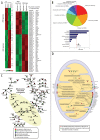
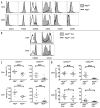
Autophagy is implicated in many functions of mammalian cells such as organelle recycling, survival and differentiation, and is essential for the maintenance of T and B lymphocytes. Here, we demonstrate that autophagy is a constitutive process during T cell development. Deletion of the essential autophagy genes Atg5 or Atg7 in T cells resulted in decreased thymocyte and peripheral T cell numbers, and Atg5-deficient T cells had a decrease in cell survival. We employed functional-genetic and integrative computational analyses to elucidate specific functions of the autophagic process in developing T-lineage lymphocytes. Our whole-genome transcriptional profiling identified a set of 699 genes differentially expressed in Atg5-deficient and Atg5-sufficient thymocytes (Atg5-dependent gene set). Strikingly, the Atg5-dependent gene set was dramatically enriched in genes encoding proteins associated with the mitochondrion. In support of a role for autophagy in mitochondrial maintenance in T lineage cells, the deletion of Atg5 led to increased mitochondrial mass in peripheral T cells. We also observed a correlation between mitochondrial mass and Annexin-V staining in peripheral T cells. We propose that autophagy is critical for mitochondrial maintenance and T cell survival. We speculate that, similar to its role in yeast or mammalian liver cells, autophagy is required in T cells for the removal of damaged or aging mitochondria and that this contributes to the cell death of autophagy-deficient T cells.
Figures


Similar articles
-
A critical role for the autophagy gene Atg5 in T cell survival and proliferation.J Exp Med. 2007 Jan 22;204(1):25-31. doi: 10.1084/jem.20061303. Epub 2006 Dec 26. J Exp Med. 2007. PMID: 17190837 Free PMC article.
-
Reciprocal effects of rab7 deletion in activated and neglected T cells.Autophagy. 2013 Jul;9(7):1009-23. doi: 10.4161/auto.24468. Epub 2013 Apr 15. Autophagy. 2013. PMID: 23615463 Free PMC article.
-
Temporal regulation of intracellular organelle homeostasis in T lymphocytes by autophagy.J Immunol. 2011 May 1;186(9):5313-22. doi: 10.4049/jimmunol.1002404. Epub 2011 Mar 18. J Immunol. 2011. PMID: 21421856
-
Role of autophagy in diabetes and mitochondria.Ann N Y Acad Sci. 2010 Jul;1201:79-83. doi: 10.1111/j.1749-6632.2010.05614.x. Ann N Y Acad Sci. 2010. PMID: 20649543 Review.
-
Molecular mechanisms and physiological roles of Atg5/Atg7-independent alternative autophagy.Proc Jpn Acad Ser B Phys Biol Sci. 2017;93(6):378-385. doi: 10.2183/pjab.93.023. Proc Jpn Acad Ser B Phys Biol Sci. 2017. PMID: 28603209 Free PMC article. Review.
Cited by
-
Crosstalk between autophagy and inflammatory signalling pathways: balancing defence and homeostasis.Nat Rev Immunol. 2016 Nov;16(11):661-675. doi: 10.1038/nri.2016.100. Epub 2016 Oct 3. Nat Rev Immunol. 2016. PMID: 27694913 Free PMC article. Review.
-
Role of Autophagy in the Maintenance of Intestinal Homeostasis.Gastroenterology. 2015 Sep;149(3):553-62. doi: 10.1053/j.gastro.2015.06.046. Epub 2015 Jul 11. Gastroenterology. 2015. PMID: 26170139 Free PMC article. Review.
-
Quantitative Proteome Analysis of Atg5-Deficient Mouse Embryonic Fibroblasts Reveals the Range of the Autophagy-Modulated Basal Cellular Proteome.mSystems. 2019 Nov 5;4(6):e00481-19. doi: 10.1128/mSystems.00481-19. mSystems. 2019. PMID: 31690592 Free PMC article.
-
Impact of Paneth Cell Autophagy on Inflammatory Bowel Disease.Front Immunol. 2018 Apr 5;9:693. doi: 10.3389/fimmu.2018.00693. eCollection 2018. Front Immunol. 2018. PMID: 29675025 Free PMC article. Review.
-
Autophagy regulates endoplasmic reticulum homeostasis and calcium mobilization in T lymphocytes.J Immunol. 2011 Feb 1;186(3):1564-74. doi: 10.4049/jimmunol.1001822. Epub 2010 Dec 29. J Immunol. 2011. PMID: 21191072 Free PMC article.
References
Publication types
MeSH terms
Substances
Grants and funding
- R01-DK83756/DK/NIDDK NIH HHS/United States
- R01-AI062773/AI/NIAID NIH HHS/United States
- R01-AI061077/AI/NIAID NIH HHS/United States
- CA74730/CA/NCI NIH HHS/United States
- R01 CA074730/CA/NCI NIH HHS/United States
- R01 AI061077/AI/NIAID NIH HHS/United States
- R01 AI062773/AI/NIAID NIH HHS/United States
- R01 DK083756/DK/NIDDK NIH HHS/United States
- P30-AR048335/AR/NIAMS NIH HHS/United States
- 5-T32-AI07163-27/AI/NIAID NIH HHS/United States
- U54A1057160/PHS HHS/United States
- P30 AR048335/AR/NIAMS NIH HHS/United States
- T32 AI007163/AI/NIAID NIH HHS/United States
LinkOut - more resources
Full Text Sources
Other Literature Sources
Molecular Biology Databases
