. 2009 May;119(5):1109-23.
doi: 10.1172/JCI35660. Epub 2009 Apr 13.

_targeting autophagy potentiates tyrosine kinase inhibitor-induced cell death in Philadelphia chromosome-positive cells, including primary CML stem cells

Affiliations

_targeting autophagy potentiates tyrosine kinase inhibitor-induced cell death in Philadelphia chromosome-positive cells, including primary CML stem cells

Cristian Bellodi et al. J Clin Invest. 2009 May.

Erratum in

  • J Clin Invest. 2013 Aug 1;123(8):3634

Abstract

Imatinib mesylate (IM), a potent inhibitor of the BCR/ABL tyrosine kinase, has become standard first-line therapy for patients with chronic myeloid leukemia (CML), but the frequency of resistance increases in advancing stages of disease. Elimination of BCR/ABL-dependent intracellular signals triggers apoptosis, but it is unclear whether this activates additional cell survival and/or death pathways. We have shown here that IM induces autophagy in CML blast crisis cell lines, CML primary cells, and p210BCR/ABL-expressing myeloid precursor cells. IM-induced autophagy did not involve c-Abl or Bcl-2 activity but was associated with ER stress and was suppressed by depletion of intracellular Ca2+, suggesting it is mechanistically nonoverlapping with IM-induced apoptosis. We further demonstrated that suppression of autophagy using either pharmacological inhibitors or RNA interference of essential autophagy genes enhanced cell death induced by IM in cell lines and primary CML cells. Critically, the combination of a tyrosine kinase inhibitor (TKI), i.e., IM, nilotinib, or dasatinib, with inhibitors of autophagy resulted in near complete elimination of phenotypically and functionally defined CML stem cells. Together, these findings suggest that autophagy inhibitors may enhance the therapeutic effects of TKIs in the treatment of CML.


Figures
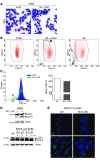
Figure 1
Figure 1. Effects of IM treatment on morphology and autophagy in K562 cells.
(A) Light microscopy images of May-Grünwald–stained untreated or IM-treated K562 cells. Cells were cultured for 36 hours in the absence or presence of 2 μM IM and processed for May-Grünwald staining. Original magnification, ×40. (B and C) Reduced size of IM-treated K562 cells. The size of K562 cells treated with zVAD, IM, or IM and zVAD was analyzed using a cytofluorimeter. Representative dot plots of physical parameters forward light scatter-height/side light scatter-height (FSC-H/SSC-H) are shown. The yellow arrows indicate a subpopulation of smaller and denser cells in IM/zVAD-treated cultures, while the black arrow shows dying cells after treatment with IM only. Large boxes indicate viable cells; small box indicates denser cells appearing upon IM/zVAD treatment. (C) Representative histograms of the forward light scatter-height parameter are shown. (D) Accumulation of autophagosome-associated LC3-II in IM-treated K562 cells. The Western blot shows endogenous LC3-I and LC3-II levels (upper panel) or ectopic EGFP–LC3-I and EGFP–LC3-II expression (lower panel) in extracts from untreated (control) or IM-treated cells (at 6 and 12 hours). The asterisk indicates that bands are not specific for LC3 (lower panel). Actin was measured as loading control. (E) Formation of LC3-positive vesicles in IM-treated EGFP-LC3–transduced K562 cells. EGFP-LC3 K562 cells were cultured in the presence or absence of IM and stained with anti-LC3 antibody (red). Nuclei were counterstained with DAPI. Scale bar: 10 μm.
Figure 2
Figure 2. Autophagy in IM-treated 32D-p210BCR/ABL cells.
(A) Formation of LC3-positive vacuoles in IM-treated 32D-p210BCR/ABL cells. Cells were treated for 12 hours with 1 μM IM, and LC3 levels were analyzed by IF/confocal microscopy (anti-LC3, red). Arrowheads indicated autophagic vesicles. Scale bar: 10 μm. (B) Western blot detection of LC3-I and LC3-II in IM-treated 32D-p210BCR/ABL cells (6 hours). Actin was measured as loading control. (C) IL-3 inhibits IM-induced autophagy in EGFP-LC3–transduced 32D-p210BCR/ABL cells. Cells were cultured for 3 and 6 hours in the presence of different concentrations of IL-3 and IM, as indicated. The asterisk indicates that bands are not specific for LC3. The LC3-I to LC3-II ratio was calculated by densitometric analysis. Actin was measured as loading control. nd, not determined. (D) LC3-I/LC3-II levels in v-Src–transformed 32D cells stably expressing EGFP-LC3. Cells were treated for 6 or 12 hours with the indicated concentrations of IM, and LC3-I/LC3-II levels were analyzed by Western blot using an anti-LC3 antibody. The asterisk indicates that bands are not specific for LC3. Actin was detected as loading control. (E) IM treatment of 32D cells expressing the IM-resistant T315I p210BCR/ABL mutant (32D-T315Ip210BCR/ABL cells) does not induce autophagy. 32D cells expressing the IM-resistant T315I p210BCR/ABL mutant were treated with 1 μM IM and analyzed for LC3-I/LC3-II levels. Actin was detected as internal control. (F) Expression of T315I c-Abl in 32D-p210BCR/ABL cells does not block IM-induced LC3-II accumulation. p210BCR/ABL/T315I c-Abl coexpressing 32D cells were treated with IM and analyzed for LC3-I/LC3-II levels. Actin was detected as loading control.
Figure 3
Figure 3. IM-induced autophagy is preceded by ER stress and relies on intracellular Ca2+.
(A) Induction of CHOP expression in IM-treated 32D-p210BCR/ABL cells. CHOP mRNA levels were measured by quantitative real-time PCR in cells treated for 1, 3, or 6 hours with 1 μM IM. Values represent mean ± SEM. (B) Induction of Grp78 expression in IM-treated 32D-p210BCR/ABL cells. Cells were harvested and lysed at the indicated times after the addition of IM. Extracts were probed with anti-GRP78 and anti-actin as loading control. (C) ER Ca2+ content was estimated by adding 5 μM thapsigargin (a SERCA pump inhibitor) to Fura-2–loaded 32D-p210BCR/ABL cells. The experiment was conducted at 37°C in a Ca2+-free buffer. (D) Histogram shows mean ± SEM of Ca2+ rise (peak minus basal 340/380 fluorescence ratio) induced by 5 μM thapsigargin in 6 separate experiments. *P < 0.05, unpaired Student’s t test. (E) Western blot shows LC3-I/LC3-II levels in EGFP-LC3 32D-p210BCR/ABL cells treated (6 hours) with the indicated concentration of IM, EGTA, and Bapta/AM. The LC3-I/LC3-II ratio was determined by densitometric analysis and normalized according to the levels of β-actin in each sample (lower panel). (F) Western blot shows LC3-I/LC3-II levels in EGFP-LC3–transduced K562 cells after the indicated treatments (6 hours). The LC3-I/LC3-II ratio was determined as in E. The asterisks indicate that bands are not specific for LC3 (E and F).
Figure 4
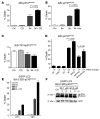
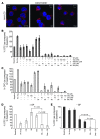
Figure 4. Inhibition of autophagy potentiates IM-induced cell death in 32D-p210BCR/ABL cells.
(A) 32D-p210BCR/ABL cells were cultured for 12 hours in the presence or absence of 1 μM IM, alone, or in combination with 5 μM CQ. Cell death was measured by annexin V staining. Values represent the mean ± SEM of 3 independent experiments. Data were analyzed by unpaired Student’s t test. (B) 32D-p210BCR/ABL cells were treated with 1 μM IM (12 hours), alone or in combination with 20 nM Ba. Cell death was measured as above. Values represent the mean ± SEM of 2 independent experiments. (C) CQ has no effects in 32D cells expressing the IM-resistant T315I p210BCR/ABL mutant. 32D cells expressing the IM-resistant T315I p210BCR/ABL mutant were treated with IM, with or without CQ, and analyzed for cell death induction as in A. (D) CQ-induced cell death is caspase independent. 32D-p210BCR/ABL cells were cultured for 6 hours in the presence or absence of different combination of 1 μM IM, 50 μM zVAD, and 5 μM CQ. The percentage of cell death was determined as above. Caspase activity was measured in extracts using a DVED fluorescent substrate. (E) Bcl-2 does not block CQ-mediated sensitization to IM. 32D-p210BCR/ABL cells ectopically expressing Bcl-2 (Bcl-2 32D-p210BCR/ABL) were cultured with 1 μM IM alone or in combination with 5 μM CQ. Cell death was measured as above. Values represent mean ± SEM (CE). (F) Bcl-2 does not block IM-induced LC3-II accumulation. Western blot shows LC3-I/LC3-II levels in extracts of 32D-p210BCR/ABL cells ectopically expressing Bcl-2 treated for 6 or 12 hours with the indicated concentrations of IM. β-actin was detected as loading control.
Figure 5
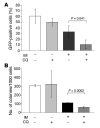
Figure 5. CQ treatment potentiates the effect of IM in mice inoculated with GFP-LC3 32D-p210BCR/ABL cells.
(A) GFP-positive cells in the bone marrow of untreated or treated (CQ, IM, or the CQ/IM combination) leukemic mice. (B) Cytokine-independent colony formation from bone marrow cells of untreated or treated (CQ, IM, or the CQ/IM combination) leukemic mice. Values represent SD.
Figure 6
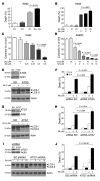
Figure 6. Inhibition of autophagy increases IM-induced cell death in K562 cells.
(A and B) Effects of CQ (A) and Ba (B) in IM-treated K562 cells. Cells were cultured for 48 hours in the presence or absence of 5 μM CQ and 2 μM IM (A) or Ba and IM as indicated (B), and cell death was measured by annexin V immunostaining. Values represent the mean ± SEM of 3 independent experiments. Data were analyzed by unpaired Student’s t test. (C and D) CQ potentiates the effect of IM in clonogenic assays of parental (C) and IM-resistant (D) K562 cells. Cells were plated in methylcellulose in the absence or in the presence of IM and CQ, and colonies were counted 10 days later. Values (expressed as percentage of control) represent the mean ± SEM of 3 (C) or 2 (D) independent experiments. (EJ) ATG5 or ATG7 downregulation enhances IM-induced cell death. K562 cells were transfected with control or ATG5 (E and F) or ATG7 (G and H) siRNAs and analyzed for ATG5 (E, upper panel) and ATG7 (G, upper panel) expression 48 hours after transfection. Levels of actin were measured as loading control. The asterisk indicates that bands are not specific for LC3. Forty-eight hours after transfection, cells were treated with IM and analyzed for LC3 and actin expression (E and G, lower panels). Cell death was measured by annexin V staining 24 (white bars) and 40 hours (black bars) after IM treatment (F and H). K562 cells were transduced with scrambled (SO) or ATG7 shRNA pGIPZ lentiviral vectors, and levels of ATG7, actin, and LC3 (I) and IM-induced cell death (annexin V staining) were measured at 24 (white bars) and 40 hours (black bars) (J). Values represent the mean ± SEM of 3 independent experiments.
Figure 7
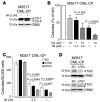
Figure 7. Autophagy is induced in IM-treated primary CML cells and acts as a survival mechanism.
(A) Accumulation of LC3-II in IM-treated CD34+ CML (M351T) cells. Cells were treated with IM (2 μM) or left untreated. Extracts were probed with anti-LC3 and anti-GRB2 antibodies. LC3-II/LC3-I ratio was determined by densitometric analysis. (B) CQ potentiates the effect of IM in clonogenic assays. CD34+ CML cells were plated in methylcellulose in the presence or in the absence of IM (0.5 or 1.0 μM) and CQ (10.0 μM). Colonies were counted 10 days later. Values (expressed as percentage of control) are representative of 3 independent experiments. (C) siRNA-mediated downregulation of ATG5 or ATG7 expression enhances IM-induced inhibition of colony formation. CD34+ CML cells were transfected with control or ATG5 or ATG7 siRNAs and, 24 hours later, left untreated or treated with IM (1 μM). Twenty-four hours later, cells were plated in methylcellulose in the presence or absence of IM. Colonies were counted 10 days later. Values are representative of 2 independent experiments. Values represent mean ± SEM (B and C). (D) ATG5 and ATG7 levels in siRNA transfected CML cells. Western blots show ATG5 and ATG7 expression in M351T CML-CP lysates 24 hours after transfection with scrambled or Atg5- or Atg7-specific siRNA. GRB2 levels were measured as loading control. The asterisk indicates that bands are not specific for LC3.
Figure 8
Figure 8. TKI treatment in combination with inhibition of autophagy results in near complete eradication of CML stem cells.
(A) Induction of LC3-positive autophagosomes in TKI-treated CML stem cells. CD34+CD38 cells were stained with an anti-LC3 antibody and analyzed by confocal microscopy. Nuclei were stained with DAPI; CML-CP CD34+ cells (n = 3) were sorted into progenitor (CD34+CD38+) (B) and stem (CD34+CD38) (C) cell populations. Cells were left untreated or pretreated for 48 hours with IM (0.5 and 2.0 μM), Das (10.0 and 150.0 nM), or Nilotinib (2.0 μM) (CD34+CD38+ cells only), either alone or in combination with CQ (10.0 μM) or Ba (20.0 nM). Cells were then plated in methylcellulose in the presence or absence of indicated drug concentrations (as per pretreatment). Colonies were counted at 14 days and compared with those derived from cells at baseline (cells with no prior culture or treatment) taken as 100%. Values represent the mean ± SEM. (D and E) For long-term culture experiments, CML-CP CD34+ cells (n = 3) were cultured in SFM with (D) and without (E) growth factors (GFs) and left untreated or pretreated for 6 days with TKIs (IM, 2 μM, or Das, 150 nM) or CQ (10 μM) alone or the TKI/CQ combination, before being added to the LTC-IC feeders. Resulting colonies were compared with those derived from cells at baseline (cells with no prior culture or treatment) and taken as 100%. Values represent the mean ± SEM. E is presented on a logarithmic scale due to the great differences between baseline and TKI/combination-treated arms.
Figure 9
Figure 9. Inhibition of autophagy potentiates IM-induced cell death in CML cells.
In addition to programmed cell death, inhibition of BCR/ABL causes autophagy, which acts as a survival mechanism in CML cells. Treatment with autophagy inhibitors such as CQ results in potentiation of IM-induced cell death.

Similar articles

Cited by

References

    1. Kantarjian H.M., et al. Chronic myelogenous leukemia in blast crisis. Analysis of 242 patients. Am. J. Med. 1987;83:445–454. - PubMed
    1. Savage D.G., Szydlo R.M., Goldman J.M. Clinical features at diagnosis in 430 patients with chronic myeloid leukaemia seen at a referral centre over a 16-year period. Br. J. Haematol. 1997;96:111–116. - PubMed
    1. Spiers A.S. Clinical manifestations of chronic granulocytic leukemia. Semin. Oncol. 1995;22:380–395. - PubMed
    1. Ben-Neriah Y., Daley G.Q., Mes-Masson A.M., Witte O.N., Baltimore D. The chronic myelogenous leukemia-specific P210 protein is the product of the bcr/abl hybrid gene. Science. 1986;233:212–214. - PubMed
    1. Cortez D., Kadlec L., Pendergast A.M. Structural and signaling requirements for BCR-ABL-mediated transformation and inhibition of apoptosis. Mol. Cell. Biol. 1995;15:5531–5541. - PMC - PubMed

Publication types

MeSH terms

  NODES
INTERN 1
twitter 2