Dkk-3 is elevated in CSF and plasma of Alzheimer's disease patients
- PMID: 19457090
- PMCID: PMC4311140
- DOI: 10.1111/j.1471-4159.2009.06158.x
Dkk-3 is elevated in CSF and plasma of Alzheimer's disease patients
Abstract
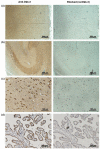
Biomarkers in CSF can offer improved diagnostic accuracy for Alzheimer's disease (AD). The present study investigated whether the glycoprotein and putative tumor suppressor Dickkopf homolog 3 (Dkk-3) is secreted into CSF and evaluated its applicability as a diagnostic marker for AD. Using our highly specific immunoenzymometric assay, Dkk-3 levels were measured in plasma and/or CSF of patients suffering from depression, mild cognitive impairment (MCI), or AD and compared with healthy subjects. Dkk-3 identity was verified by western blot and matrix-assisted laser desorption/ionization time-of-flight (MALDI-TOF) mass spectrometry (MS)/MS. High concentrations of Dkk-3 were detected in CSF compared with plasma (28.2 +/- 1.3 vs. 1.22 +/- 0.04 nmol/L, respectively). Consistently Dkk-3 expression was demonstrated in neurons of the cortex and epithelial cells of the choroid plexus, the major source of CSF. Significantly increased Dkk-3 levels in plasma and CSF were observed for AD patients compared with healthy subjects but not patients suffering from MCI or depression. In summary, our data indicate that elevated Dkk-3 levels are specifically associated with AD and might serve as a potential non-invasive AD biomarker in plasma.
Figures


Similar articles
-
Macrophage colony-stimulating factor (M-CSF) in plasma and CSF of patients with mild cognitive impairment and Alzheimer's disease.Curr Alzheimer Res. 2010 Aug;7(5):409-14. doi: 10.2174/156720510791383813. Curr Alzheimer Res. 2010. PMID: 20455868
-
Growth factors and cytokines/chemokines as surrogate biomarkers in cerebrospinal fluid and blood for diagnosing Alzheimer's disease and mild cognitive impairment.Exp Gerontol. 2010 Jan;45(1):41-6. doi: 10.1016/j.exger.2009.10.011. Epub 2009 Oct 22. Exp Gerontol. 2010. PMID: 19853649 Review.
-
Does serum uric acid act as a modulator of cerebrospinal fluid Alzheimer's disease biomarker related cognitive decline?Eur J Neurol. 2016 May;23(5):948-57. doi: 10.1111/ene.12969. Epub 2016 Feb 24. Eur J Neurol. 2016. PMID: 26917248
-
A New Serum Biomarker Set to Detect Mild Cognitive Impairment and Alzheimer's Disease by Peptidome Technology.J Alzheimers Dis. 2020;73(1):217-227. doi: 10.3233/JAD-191016. J Alzheimers Dis. 2020. PMID: 31771070 Free PMC article.
-
Update on the biomarker core of the Alzheimer's Disease Neuroimaging Initiative subjects.Alzheimers Dement. 2010 May;6(3):230-8. doi: 10.1016/j.jalz.2010.03.008. Alzheimers Dement. 2010. PMID: 20451871 Free PMC article. Review.
Cited by
-
Combined proteomic and metabolomic analyses of cerebrospinal fluid from mice with ischemic stroke reveals the effects of a Buyang Huanwu decoction in neurodegenerative disease.PLoS One. 2019 Jan 15;14(1):e0209184. doi: 10.1371/journal.pone.0209184. eCollection 2019. PLoS One. 2019. PMID: 30645580 Free PMC article.
-
Deficient Wnt Signaling and Synaptic Vulnerability in Alzheimer's Disease: Emerging Roles for the LRP6 Receptor.Front Synaptic Neurosci. 2018 Oct 30;10:38. doi: 10.3389/fnsyn.2018.00038. eCollection 2018. Front Synaptic Neurosci. 2018. PMID: 30425633 Free PMC article. Review.
-
Dkk3 prevents familial dilated cardiomyopathy development through Wnt pathway.Lab Invest. 2016 Feb;96(2):239-48. doi: 10.1038/labinvest.2015.145. Epub 2015 Dec 7. Lab Invest. 2016. PMID: 26641069
-
Integrated Proteomic and Phosphoproteomics Analysis of DKK3 Signaling Reveals Activated Kinase in the Most Aggressive Gallbladder Cancer.Cells. 2021 Feb 28;10(3):511. doi: 10.3390/cells10030511. Cells. 2021. PMID: 33670899 Free PMC article.
-
Molecular mechanisms of developmental pathways in neurological disorders: a pharmacological and therapeutic review.Open Biol. 2022 Mar;12(3):210289. doi: 10.1098/rsob.210289. Epub 2022 Mar 16. Open Biol. 2022. PMID: 35291879 Free PMC article. Review.
References
-
- Bibl M, Mollenhauer B, Esselmann H, et al. Cerebrospinal fluid neurochemical phenotypes in vascular dementias: original data and mini-review. Dement. Geriatr. Cogn. Disord. 2008;25:256–265. - PubMed
-
- Blasko I, Lederer W, Oberbauer H, Walch T, Kemmler G, Hinterhuber H, Marksteiner J, Humpel C. Measurement of thirteen biological markers in CSF of patients with Alzheimer’s disease and other dementias. Dement. Geriatr. Cogn. Disord. 2006;21:9–15. - PubMed
-
- Blennow K. CSF biomarkers for mild cognitive impairment. J. Intern. Med. 2004;256:224–234. - PubMed
-
- Blennow K. CSF biomarkers for Alzheimer’s disease: use in early diagnosis and evaluation of drug treatment. Expert Rev. Mol. Diagn. 2005;5:661–672. - PubMed
Publication types
MeSH terms
Substances
Grants and funding
LinkOut - more resources
Full Text Sources
Other Literature Sources
Medical

