ATP-citrate lyase links cellular metabolism to histone acetylation
- PMID: 19461003
- PMCID: PMC2746744
- DOI: 10.1126/science.1164097
ATP-citrate lyase links cellular metabolism to histone acetylation
Abstract
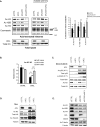
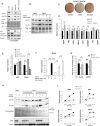
Histone acetylation in single-cell eukaryotes relies on acetyl coenzyme A (acetyl-CoA) synthetase enzymes that use acetate to produce acetyl-CoA. Metazoans, however, use glucose as their main carbon source and have exposure only to low concentrations of extracellular acetate. We have shown that histone acetylation in mammalian cells is dependent on adenosine triphosphate (ATP)-citrate lyase (ACL), the enzyme that converts glucose-derived citrate into acetyl-CoA. We found that ACL is required for increases in histone acetylation in response to growth factor stimulation and during differentiation, and that glucose availability can affect histone acetylation in an ACL-dependent manner. Together, these findings suggest that ACL activity is required to link growth factor-induced increases in nutrient metabolism to the regulation of histone acetylation and gene expression.
Figures


Comment in
-
Biochemistry. A glucose-to-gene link.Science. 2009 May 22;324(5930):1021-2. doi: 10.1126/science.1174665. Science. 2009. PMID: 19460991 Free PMC article. No abstract available.
Similar articles
-
Biochemistry. A glucose-to-gene link.Science. 2009 May 22;324(5930):1021-2. doi: 10.1126/science.1174665. Science. 2009. PMID: 19460991 Free PMC article. No abstract available.
-
ATP-citrate lyase is essential for high glucose-induced histone hyperacetylation and fibrogenic gene upregulation in mesangial cells.Am J Physiol Renal Physiol. 2017 Aug 1;313(2):F423-F429. doi: 10.1152/ajprenal.00029.2017. Epub 2017 May 10. Am J Physiol Renal Physiol. 2017. PMID: 28490526
-
Mammalian SIRT6 Represses Invasive Cancer Cell Phenotypes through ATP Citrate Lyase (ACLY)-Dependent Histone Acetylation.Genes (Basel). 2021 Sep 21;12(9):1460. doi: 10.3390/genes12091460. Genes (Basel). 2021. PMID: 34573442 Free PMC article.
-
Exploring the Role of ATP-Citrate Lyase in the Immune System.Front Immunol. 2021 Feb 18;12:632526. doi: 10.3389/fimmu.2021.632526. eCollection 2021. Front Immunol. 2021. PMID: 33679780 Free PMC article. Review.
-
ATP citrate lyase: A central metabolic enzyme in cancer.Cancer Lett. 2020 Feb 28;471:125-134. doi: 10.1016/j.canlet.2019.12.010. Epub 2019 Dec 9. Cancer Lett. 2020. PMID: 31830561 Review.
Cited by
-
YAP and TAZ Mediators at the Crossroad between Metabolic and Cellular Reprogramming.Metabolites. 2021 Mar 8;11(3):154. doi: 10.3390/metabo11030154. Metabolites. 2021. PMID: 33800464 Free PMC article. Review.
-
Mitophagy plays a central role in mitochondrial ageing.Mamm Genome. 2016 Aug;27(7-8):381-95. doi: 10.1007/s00335-016-9651-x. Epub 2016 Jun 28. Mamm Genome. 2016. PMID: 27352213 Free PMC article. Review.
-
Metabolic regulation of histone post-translational modifications.ACS Chem Biol. 2015 Jan 16;10(1):95-108. doi: 10.1021/cb500846u. ACS Chem Biol. 2015. PMID: 25562692 Free PMC article. Review.
-
Lipid Metabolism in Tumor-Associated Myeloid-Derived Suppressor Cells.Adv Exp Med Biol. 2021;1316:103-115. doi: 10.1007/978-981-33-6785-2_7. Adv Exp Med Biol. 2021. PMID: 33740246
-
Lipid metabolism alteration contributes to and maintains the properties of cancer stem cells.Theranostics. 2020 May 30;10(16):7053-7069. doi: 10.7150/thno.41388. eCollection 2020. Theranostics. 2020. PMID: 32641978 Free PMC article. Review.
References
Publication types
MeSH terms
Substances
Grants and funding
LinkOut - more resources
Full Text Sources
Other Literature Sources
Molecular Biology Databases

