A physiological increase in the hepatic glycogen level does not affect the response of net hepatic glucose uptake to insulin
- PMID: 19470836
- PMCID: PMC2724107
- DOI: 10.1152/ajpendo.00043.2009
A physiological increase in the hepatic glycogen level does not affect the response of net hepatic glucose uptake to insulin
Abstract
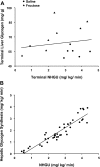
To determine the effect of an acute increase in hepatic glycogen on net hepatic glucose uptake (NHGU) and disposition in response to insulin in vivo, studies were performed on two groups of dogs fasted 18 h. During the first 4 h of the study, somatostatin was infused peripherally, while insulin and glucagon were replaced intraportally in basal amounts. Hyperglycemia was brought about by glucose infusion, and either saline (n = 7) or fructose (n = 7; to stimulate NHGU and glycogen deposition) was infused intraportally. A 2-h control period then followed, during which the portal fructose and saline infusions were stopped, allowing NHGU and glycogen deposition in the fructose-infused animals to return to rates similar to those of the animals that received the saline infusion. This was followed by a 2-h experimental period, during which hyperglycemia was continued but insulin infusion was increased fourfold in both groups. During the initial 4-h glycogen loading period, NHGU averaged 1.18 +/- 0.27 and 5.55 +/- 0.53 mg x kg(-1) x min(-1) and glycogen synthesis averaged 0.72 +/- 0.24 and 3.98 +/- 0.57 mg x kg(-1) x min(-1) in the saline and fructose groups, respectively (P < 0.05). During the 2-h hyperinsulinemic period, NHGU rose from 1.5 +/- 0.4 and 0.9 +/- 0.2 to 3.1 +/- 0.6 and 2.5 +/- 0.5 mg x kg(-1) x min(-1) in the saline and fructose groups, respectively, a change of 1.6 mg x kg(-1) x min(-1) in both groups despite a significantly greater liver glycogen level in the fructose-infused group. Likewise, the metabolic fate of the extracted glucose (glycogen, lactate, or carbon dioxide) was not different between groups. These data indicate that an acute physiological increase in the hepatic glycogen content does not alter liver glucose uptake and storage under hyperglycemic/hyperinsulinemic conditions in the dog.
Figures


Similar articles
-
Small amounts of fructose markedly augment net hepatic glucose uptake in the conscious dog.Diabetes. 1998 Jun;47(6):867-73. doi: 10.2337/diabetes.47.6.867. Diabetes. 1998. PMID: 9604861
-
Inclusion of low amounts of fructose with an intraduodenal glucose load markedly reduces postprandial hyperglycemia and hyperinsulinemia in the conscious dog.Diabetes. 2002 Feb;51(2):469-78. doi: 10.2337/diabetes.51.2.469. Diabetes. 2002. PMID: 11812757
-
Comparison of the time courses of insulin and the portal signal on hepatic glucose and glycogen metabolism in the conscious dog.J Clin Invest. 1996 Jan 1;97(1):81-91. doi: 10.1172/JCI118410. J Clin Invest. 1996. PMID: 8550854 Free PMC article.
-
Control of hepatic glucose output by glucagon and insulin in the intact dog.Biochem Soc Symp. 1978;(43):31-45. Biochem Soc Symp. 1978. PMID: 373768 Review.
-
Regulation of hepatic glucose uptake and storage in vivo.Adv Nutr. 2012 May 1;3(3):286-94. doi: 10.3945/an.112.002089. Adv Nutr. 2012. PMID: 22585902 Free PMC article. Review.
Cited by
-
Fructose might contribute to the hypoglycemic effect of honey.Molecules. 2012 Feb 15;17(2):1900-15. doi: 10.3390/molecules17021900. Molecules. 2012. PMID: 22337138 Free PMC article. Review.
-
Aerobic exercise training improves hepatic and muscle insulin sensitivity, but reduces splanchnic glucose uptake in obese humans with type 2 diabetes.Nutr Diabetes. 2019 Sep 2;9(1):25. doi: 10.1038/s41387-019-0090-0. Nutr Diabetes. 2019. PMID: 31474750 Free PMC article.
-
Liver glycogen-induced enhancements in hypoglycemic counterregulation require neuroglucopenia.Am J Physiol Endocrinol Metab. 2021 May 1;320(5):E914-E924. doi: 10.1152/ajpendo.00501.2020. Epub 2021 Mar 29. Am J Physiol Endocrinol Metab. 2021. PMID: 33779306 Free PMC article.
-
Glucose autoregulation is the dominant component of the hormone-independent counterregulatory response to hypoglycemia in the conscious dog.Am J Physiol Endocrinol Metab. 2017 Sep 1;313(3):E273-E283. doi: 10.1152/ajpendo.00099.2017. Epub 2017 May 16. Am J Physiol Endocrinol Metab. 2017. PMID: 28512154 Free PMC article.
-
Exercise-Induced Improvements to Whole Body Glucose Metabolism in Type 2 Diabetes: The Essential Role of the Liver.Front Endocrinol (Lausanne). 2020 Aug 28;11:567. doi: 10.3389/fendo.2020.00567. eCollection 2020. Front Endocrinol (Lausanne). 2020. PMID: 32982968 Free PMC article. Review.
References
-
- Adkins-Marshall BA, Myers SR, Hendrick GK, Williams PE, Triebwasser K, Floyd B, Cherrington AD. Interaction between insulin and glucose-delivery route in regulation of net hepatic glucose uptake in conscious dogs. Diabetes 39: 87–95, 1990. - PubMed
-
- Basu A, Basu R, Shah P, Vella A, Johnson CM, Jensen M, Nair KS, Schwenk WF, Rizza RA. Type 2 diabetes impairs splanchnic uptake of glucose but does not alter intestinal glucose absorption during enteral glucose feeding: additional evidence for a defect in hepatic glucokinase activity. Diabetes 50: 1351–1362, 2001. - PubMed
-
- Basu A, Basu R, Shah P, Vella A, Johnson CM, Nair KS, Jensen MD, Schwenk WF, Rizza RA. Effects of type 2 diabetes on the ability of insulin and glucose to regulate splanchnic and muscle glucose metabolism: evidence for a defect in hepatic glucokinase activity. Diabetes 49: 272–283, 2000. - PubMed
-
- Basu R, Basu A, Johnson CM, Schwenk WF, Rizza RA. Insulin dose-response curves for stimulation of splanchnic glucose uptake and suppression of endogenous glucose production differ in nondiabetic humans and are abnormal in people with type 2 diabetes. Diabetes 53: 2042–2050, 2004. - PubMed
Publication types
MeSH terms
Substances
Grants and funding
LinkOut - more resources
Full Text Sources
Medical
Miscellaneous

