T-helper type 2-driven inflammation defines major subphenotypes of asthma
- PMID: 19483109
- PMCID: PMC2742757
- DOI: 10.1164/rccm.200903-0392OC
T-helper type 2-driven inflammation defines major subphenotypes of asthma
Erratum in
- Am J Respir Crit Care Med. 2009 Oct 15;180(8):796
Abstract
Rationale: T-helper type 2 (Th2) inflammation, mediated by IL-4, IL-5, and IL-13, is considered the central molecular mechanism underlying asthma, and Th2 cytokines are emerging therapeutic _targets. However, clinical studies increasingly suggest that asthma is heterogeneous.
Objectives: To determine whether this clinical heterogeneity reflects heterogeneity in underlying molecular mechanisms related to Th2 inflammation.
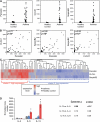
Methods: Using microarray and polymerase chain reaction analyses of airway epithelial brushings from 42 patients with mild-to-moderate asthma and 28 healthy control subjects, we classified subjects with asthma based on high or low expression of IL-13-inducible genes. We then validated this classification and investigated its clinical implications through analyses of cytokine expression in bronchial biopsies, markers of inflammation and remodeling, responsiveness to inhaled corticosteroids, and reproducibility on repeat examination.
Measurements and main results: Gene expression analyses identified two evenly sized and distinct subgroups, "Th2-high" and "Th2-low" asthma (the latter indistinguishable from control subjects). These subgroups differed significantly in expression of IL-5 and IL-13 in bronchial biopsies and in airway hyperresponsiveness, serum IgE, blood and airway eosinophilia, subepithelial fibrosis, and airway mucin gene expression (all P < 0.03). The lung function improvements expected with inhaled corticosteroids were restricted to Th2-high asthma, and Th2 markers were reproducible on repeat evaluation.
Conclusions: Asthma can be divided into at least two distinct molecular phenotypes defined by degree of Th2 inflammation. Th2 cytokines are likely to be a relevant therapeutic _target in only a subset of patients with asthma. Furthermore, current models do not adequately explain non-Th2-driven asthma, which represents a significant proportion of patients and responds poorly to current therapies.
Figures


Comment in
-
Magic bullets: the new goal for asthma.Am J Respir Crit Care Med. 2009 Sep 1;180(5):383-4. doi: 10.1164/rccm.200905-0788ED. Am J Respir Crit Care Med. 2009. PMID: 19700565 No abstract available.
-
Molecular Th2 phenotypes of asthma: new biomarker or NO?Am J Respir Crit Care Med. 2010 Feb 15;181(4):419; author reply 419. doi: 10.1164/ajrccm.181.4.419. Am J Respir Crit Care Med. 2010. PMID: 20130148 No abstract available.
Similar articles
-
A Transcriptome-driven Analysis of Epithelial Brushings and Bronchial Biopsies to Define Asthma Phenotypes in U-BIOPRED.Am J Respir Crit Care Med. 2017 Feb 15;195(4):443-455. doi: 10.1164/rccm.201512-2452OC. Am J Respir Crit Care Med. 2017. PMID: 27580351
-
Blocking IL-19 Signaling Ameliorates Allergen-Induced Airway Inflammation.Front Immunol. 2019 Apr 30;10:968. doi: 10.3389/fimmu.2019.00968. eCollection 2019. Front Immunol. 2019. PMID: 31114590 Free PMC article.
-
Gene expression patterns of Th2 inflammation and intercellular communication in asthmatic airways.J Immunol. 2011 Feb 1;186(3):1861-9. doi: 10.4049/jimmunol.1002568. Epub 2010 Dec 27. J Immunol. 2011. PMID: 21187436 Free PMC article.
-
New insights into the role of cytokines in asthma.J Clin Pathol. 2001 Aug;54(8):577-89. doi: 10.1136/jcp.54.8.577. J Clin Pathol. 2001. PMID: 11477111 Free PMC article. Review.
-
Human asthma phenotypes: from the clinic, to cytokines, and back again.Immunol Rev. 2011 Jul;242(1):220-32. doi: 10.1111/j.1600-065X.2011.01032.x. Immunol Rev. 2011. PMID: 21682748 Free PMC article. Review.
Cited by
-
IL-17-producing peripheral blood CD177+ neutrophils increase in allergic asthmatic subjects.Allergy Asthma Clin Immunol. 2013 Jul 3;9(1):23. doi: 10.1186/1710-1492-9-23. Allergy Asthma Clin Immunol. 2013. PMID: 23822853 Free PMC article.
-
From bedside to bench to clinic trials: identifying new treatments for severe asthma.Dis Model Mech. 2013 Jul;6(4):877-88. doi: 10.1242/dmm.012070. Dis Model Mech. 2013. PMID: 23828644 Free PMC article. Review.
-
An update on the diagnostic biomarkers for asthma.J Family Med Prim Care. 2021 Mar;10(3):1139-1148. doi: 10.4103/jfmpc.jfmpc_2037_20. Epub 2021 Apr 8. J Family Med Prim Care. 2021. PMID: 34041141 Free PMC article. Review.
-
A novel microbe-based treatment that attenuates the inflammatory profile in a mouse model of allergic airway disease.Sci Rep. 2016 Oct 13;6:35338. doi: 10.1038/srep35338. Sci Rep. 2016. PMID: 27734946 Free PMC article.
-
Update on anticytokine treatment for asthma.Biomed Res Int. 2013;2013:104315. doi: 10.1155/2013/104315. Epub 2013 Jun 18. Biomed Res Int. 2013. PMID: 23853765 Free PMC article. Review.
References
-
- Wills-Karp M, Luyimbazi J, Xu X, Schofield B, Neben TY, Karp CL, Donaldson DD. Interleukin-13: central mediator of allergic asthma. Science 1998;282:2258–2261. - PubMed
-
- Humbert M, Durham SR, Kimmitt P, Powell N, Assoufi B, Pfister R, Menz G, Kay AB, Corrigan CJ. Elevated expression of messenger ribonucleic acid encoding IL-13 in the bronchial mucosa of atopic and nonatopic subjects with asthma. J Allergy Clin Immunol 1997;99:657–665. - PubMed
-
- Wenzel S, Wilbraham D, Fuller R, Getz EB, Longphre M. Effect of an interleukin-4 variant on late phase asthmatic response to allergen challenge in asthmatic patients: results of two phase 2a studies. Lancet 2007;370:1422–1431. - PubMed
Publication types
MeSH terms
Substances
Grants and funding
LinkOut - more resources
Full Text Sources
Other Literature Sources
Medical

