. 2009 Jun 3;29(22):7208-19.
doi: 10.1523/JNEUROSCI.6068-08.2009.

Rat prefrontal cortical neurons selectively code strategy switches

Affiliations

Rat prefrontal cortical neurons selectively code strategy switches

Erin L Rich et al. J Neurosci. .

Abstract

Multiple memory systems are distinguished by different sets of neuronal circuits and operating principles optimized to solve different problems across mammalian species (Tulving and Schacter, 1994). When a rat selects an arm in a plus maze, for example, the choice can be guided by distinct neural systems (White and Wise, 1999) that encode different relationships among perceived stimuli, actions, and reward. Thus, egocentric or stimulus-response associations require striatal circuits, whereas spatial or episodic learning requires hippocampal circuits (Packard et al., 1989). Although these memory systems function in parallel (Packard and McGaugh, 1996), they can also interact competitively or synergistically (Kim and Ragozzino, 2005). The neuronal mechanisms that coordinate these multiple memory systems are not fully known, but converging evidence suggests that the prefrontal cortex (PFC) is central. The PFC is crucial for abstract, rule-guided behavior in primates and for switching rapidly between memory strategies in rats. We now report that rat medial PFC neuronal activity predicts switching between hippocampus- and caudate-dependent memory strategies. Prelimbic (PL) and infralimbic (IL) neuronal activity changed as rats switched memory strategies even as the rats performed identical behaviors but did not change when rats learned new contingencies using the same strategy. PL dynamics anticipated learning performance whereas IL lagged, suggesting that the two regions help initiate and establish new strategies, respectively. These neuronal dynamics suggest that the PFC contributes to the coordination of memory strategies by integrating the predictive relationships among stimuli, actions, and reward.


Figures

Figure 1.
Figure 1.
Organizing principles of plus maze behavior. Rats learned four possible paths from start to goal, e.g., N-W, N-E, etc. (base of triangle). Two paths define a task, which stipulates reward contingencies; for example, reward is always in the east arm in the “go east” task or always turn left in the “go left” task (middle row). Tasks may also be guided by abstract strategies, which do not stipulate reward contingencies but define the cognitive domain of the task; for example, “go east” requires spatial navigation and thus a place strategy, whereas “go left” requires an egocentric response strategy (triangle apex). Thus, paths, tasks, and strategies reflect increasingly abstract descriptions of behavior in the plus maze.
Figure 2.
Figure 2.
Behavior in the plus maze. a, Schematics show correct paths (arrows) for tasks before and after a switch (“go east” to “turn left”), a reversal (“go east” to “go west”), and during SP (“go east”). During switches, one path changed (dotted) whereas the consistent path did not (solid arrow); during reversals, both paths changed, and during SP, both paths were consistent. b, Learning curves calculated probabilities of a correct choice (red line) as a function of trial number and upper and lower CIs for this probability (black lines) (Smith et al., 2004). Blue stars show correct (top) and error (bottom) trials. Contingencies changed on trial 21 (“begin switch”). c, Learning curves were used to assign trials to 11 blocks and four phases (before, early, late, and after). Bars show proportions of trials correct within each block, averaged across all switches ± SEM. d, Performance (percentage ± SEM correct) did not differ before (Bef) or after (Aft) switches or reversals. e, Example paths taken by a rat while switching from response (“turn right”) to place (“go west”) strategies. Trials were parsed by learning phase, and position data (gray pixels) are displayed on a grid (actual locations were fixed on the maze throughout, but paths are shown separately for illustration). The rat performed perfectly before the switch. After contingencies were changed, the rat continued to perform perfectly on the consistent path (N-W) but erred on the changing path (S-E to S-W). No errors occurred after criterion was reached.
Figure 3.
Figure 3.
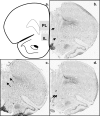
Tetrodes were located in PL and IL regions. Tetrode tips (arrows) were visualized by light microscope. Coronal sections are shown, each with clear tracks from two tetrodes each: one in PL and one in IL (b), both in PL (c), or both in IL (d).
Figure 4.
Figure 4.
PL/IL neurons responded to strategy switching with altered firing rates. Heat plots show two phase-responsive neurons (a, b) with trials parsed by phase and path (top row, consistent paths; bottom row, changing paths during the same phase). a, Firing rates (in hertz) decreased across phase on the entire maze. b, Firing rates increased in goal arms of both paths, showing a phase by region interaction. c, Among simultaneously recorded ensembles, the average proportion of cells that responded significantly to phase was highest during switches. Boxes represent median (midline), first and third quartiles (box bottom, top), and minimum and maximum (bars) for proportions of cells per session that responded to phase (bars in Rev and SP are masked by quartile boundaries). Rev, Reversal. *p < 0.05.
Figure 5.
Figure 5.
Neuron activity changed with strategy, not path or task. a, c, Position data (gray) displayed on a maze grid assessed overt behavior during consistent paths at the beginning (before) and end (after) of switches and SP. The radius of the colored circles is proportional to the number of spikes in each grid unit. Tetrode waveforms from the beginning and end of each session are shown below each path. a, Overt behavior was identical during consistent paths of switches and SP. Activity of the neuron shown in green increased after the switch, and the one shown in red did not change during SP. b, The proportion of neurons that changed firing rate when behavior was held constant (consistent paths) was higher during switches (black) than SP (white). Similarly, more neurons changed firing rate in changing paths during switches (black) than reversals (gray). Error bars show SE for each proportion. *p < 0.05. c, Changing paths before and after switches and reversals. Activity of the green neuron (also shown in a) increased after the switch; the neuron shown in yellow did not change during a reversal (bottom). d, The population of neurons recorded during switches responded more robustly to changes in strategy when behavior was constant (a, top panel, Before compared with After) than changes in behavior when strategy was constant (a, top panel, Before, compare with c, top panel, before). Among cells firing differentially to different strategies or paths (50 cells), 70% changed with strategy, 20% with path, and 10% with both.
Figure 6.
Figure 6.
PL population activity changed before IL. Transitions between activity states were quantified by average correlations of each trial block with the before (rbefore: open circles, dashed lines) and after (rafter: filled circles, solid lines) phases. Graphs display average Pearson's r for each trial block (Fisher's Z was used for statistics). For PL (a) and IL (b), population activity was initially correlated with the before phase and inversely correlated with the after phase, and these correlations reversed over trial blocks.
Figure 7.
Figure 7.
Population changes in PL preceded changes in behavior whereas IL lagged. a, Learning curves for two switch sessions (top row) show probabilities of a correct trial (y-axis) as a function of trial number (x-axis). Ticks on the x-axis show numbered trial blocks based on each learning curve. Activity from two pairs of neurons (middle and bottom rows) is aligned by trial number. PL (light gray) and IL (dark gray) cells were recorded simultaneously. Each histogram shows the proportion of total spikes during each trial of the recording session. Vertical dashed lines show the beginning of trial block 7, in which average performance began to improve. The PL neuron on the left increased activity immediately after contingencies changed and remained elevated; the IL neuron decreased activity only around trial block 7. The PL neuron on the right began to decrease soon after contingencies changed, whereas the simultaneously recorded IL neuron increased firing rate gradually and stabilized by trial block 7. b, c, Average population correlations (left axis) superimposed on learning curves (right axis). b, After contingencies changed, both PL (black) and IL (gray) population codes decayed rapidly from the before phase (rbefore). c, PL neurons approached the new code (the after phase, rafter) faster than IL. Although both populations begin with negative and end with positive correlations, IL did not increase significantly until trial block 8, when average performance (gray bars) was ∼85%. PL correlations changed significantly by trial block 5, when performance is ∼50%. *p < 0.05, PL vs IL comparisons, corrected.

Similar articles

Cited by

References

    1. Asaad WF, Rainer G, Miller EK. Task-specific neural activity in the primate prefrontal cortex. J Neurophysiol. 2000;84:451–459. - PubMed
    1. Baeg EH, Kim YB, Kim J, Ghim JW, Kim JJ, Jung MW. Learning-induced enduring changes in functional connectivity among prefrontal cortical neurons. J Neurosci. 2009;27:909–918. - PMC - PubMed
    1. Birrell JM, Brown VJ. Medial frontal cortex mediates perceptual attentional set shifting in the rat. J Neurosci. 2000;20:4320–4324. - PMC - PubMed
    1. Brass M, von Cramon DY. Decomposing components of task preparation with functional magnetic resonance imaging. J Cogn Neurosci. 2004;16:609–620. - PubMed
    1. Brown VJ, Bowman EM. Rodent models of prefrontal cortical function. Trends Neurosci. 2002;25:340–343. - PubMed

Publication types

LinkOut - more resources

  NODES
Association 1
INTERN 1
Project 1
twitter 2