. 2009 Jul 14;106(28):11742-6.
doi: 10.1073/pnas.0905614106. Epub 2009 Jun 24.

Reliable neuromodulation from circuits with variable underlying structure

Affiliations

Reliable neuromodulation from circuits with variable underlying structure

Rachel Grashow et al. Proc Natl Acad Sci U S A. .

Abstract

Recent work argues that similar network performance can result from highly variable sets of network parameters, raising the question of whether neuromodulation can be reliable across individuals with networks with different sets of synaptic strengths and intrinsic membrane conductances. To address this question, we used the dynamic clamp to construct 2-cell reciprocally inhibitory networks from gastric mill (GM) neurons of the crab stomatogastric ganglion. When the strength of the artificial inhibitory synapses (g(syn)) and the conductance of an artificial I(h) (g(h)) were varied with the dynamic clamp, a variety of network behaviors resulted, including regions of stable alternating bursting. Maps of network output as a function of g(syn) and g(h) were constructed in normal saline and again in the presence of serotonin or oxotremorine. Both serotonin and oxotremorine depolarize and excite isolated individual GM neurons, but by different cellular mechanisms. Serotonin and oxotremorine each increased the size of the parameter regions that supported alternating bursting, and, on average, increased burst frequency. Nonetheless, in both cases some parameter sets within the sample space deviated from the mean population response and decreased in frequency. These data provide insight into why pharmacological treatments that work in most individuals can generate anomalous actions in a few individuals, and they have implications for understanding the evolution of nervous systems.


Conflict of interest statement

The authors declare no conflict of interest.

Figures

Fig. 1.
Fig. 1.
Circuit output depends on both synaptic and intrinsic conductances. (A) Schematic shows circuit constructed from 2 GM neurons with the dynamic clamp. The dynamic clamp creates a symmetrical reciprocally inhibitory synaptic conductance (gsyn) and an artificial intrinsic membrane conductance (gh). These maximal conductances were varied between 10 and 115 nS. (B) Map of gsyngh parameter space for coupled GM neuronal circuits. Black, green, blue, and red describe the circuit behavior as silent, asymmetrical, spiking, and bursting, respectively. (C) Intracellular recordings show voltage traces of representative circuit activity patterns. Colors are as in B; boxed points in B correspond to the parameter values of the traces in C. (Vertical scale bar: 20 mV; horizontal scale bar: 5 s.)
Fig. 2.
Fig. 2.
Serotonin excites GM neurons. (A) Voltage recordings from a GM neuron, which was given the same current pulse (black) in control (blue) and serotonin (red). Horizontal lines: − 40 mV; 0 nA. (B) Frequency/current (FI) plot from neuron in A. (C) Mean FI curves calculated by fitting a line to each individual cell's (n = 22) FI curve, and then obtaining a mean slope and a mean y-intercept to create an “average” FI curve.
Fig. 3.
Fig. 3.
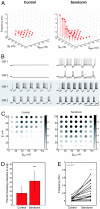
Serotonin expands the parameter sets that produce alternating bursts of activity and increases network frequency. (A) (Left) Control saline. 3D plot showing half-center frequency as a function of gsyn and gh in circuits with half-center activity. (Right) In 10−6 M serotonin. (B) Sample traces in control and serotonin. (Upper) gsyn = 55 nS and gh = 40 nS. (Lower) gsyn = 70 nS and gh = 115 nS. Horizontal line on traces indicates −50 mV. (Vertical scale bar: 20 mV; horizontal scale bar: 10 s.) (C) (Left) Distribution of bursting circuits in control. Grayscale shows the fraction of half-centers at each gsyngh parameter set (n = 17). (Right) Serotonin (10−6 M) increased the fraction of bursting circuits at many gsyngh map locations and expanded the range of parameters that produced bursting activity within the sampled parameter space. (D) Serotonin (10−6 M) increased the percentage of the map that contain bursting half-center circuits in each of 17 experiments (paired t test: P < 0.001). (E) Serotonin (10−6 M) increased the average frequency of the bursting half-center oscillator circuits in each experiment (paired t test: P < 0.001).
Fig. 4.
Fig. 4.
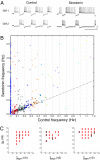
Mean serotonin-mediated increase in burst frequency masks serotonin's frequency reduction of a small number of circuits. (A) Example traces of a circuit that slowed in serotonin (gsyn = 85 nS and gh = 85 nS). Horizontal line on traces indicates −50 mV. (Vertical scale bar: 20 mV; horizontal scale bar: 20 mV). (B) Circuit frequency in 10−6 M serotonin as a function of control frequency. Asterisks indicate networks with single-spike bursts in either control or serotonin conditions. Dashed line indicates x = y. (C) Location of gsyngh parameter values of circuits that slowed (downward arrows) in 10−6 M serotonin in 3 experiments. Asterisks indicate networks with single spike bursters as seen in B.
Fig. 5.
Fig. 5.
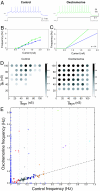
Oxotremorine excites isolated GM neurons and increases the number of single-spike bursters in reciprocally inhibitory networks. (A) Voltage recordings from a GM neuron in control (blue) and oxotremorine (green). Horizontal lines on traces indicate −40 mV. Current traces are shown in black; horizontal line indicates 0 nA. (B) FI plot from preparation shown in A. (C) Mean FI curve calculated as described in Fig. 2C (n = 14). (D) Distribution of bursting circuits in control (Left) and oxotremorine (Right). Grayscale corresponds to the fraction of half-center networks at each gsyngh parameter set across 8 preparations. Oxotremorine (10−5 M) increased the fraction of bursting circuits at many map locations and expanded the range of gsyn and gh values that produced half-centers. (E) Circuit frequency in 10−5 M oxotremorine as a function of circuit frequency in control saline. Asterisks indicate single-spike bursting networks as seen in Fig. 4B. Dashed line indicates x = y.

References

    1. Prinz AA, Bucher D, Marder E. Similar network activity from disparate circuit parameters. Nat Neurosci. 2004;7:1345–1352. - PubMed
    1. Schulz DJ, Goaillard JM, Marder E. Variable channel expression in identified single and electrically coupled neurons in different animals. Nat Neurosci. 2006;9:356–362. - PubMed
    1. Schulz DJ, Goaillard JM, Marder EE. Quantitative expression profiling of identified neurons reveals cell-specific constraints on highly variable levels of gene expression. Proc Natl Acad Sci USA. 2007;104:13187–13191. - PMC - PubMed
    1. Goldman MS, Golowasch J, Marder E, Abbott LF. Global structure, robustness, and modulation of neuronal models. J Neurosci. 2001;21:5229–5238. - PMC - PubMed
    1. Golowasch J, Abbott LF, Marder E. Activity-dependent regulation of potassium currents in an identified neuron of the stomatogastric ganglion of the crab Cancer borealis. J Neurosci. 1999;19:RC33. - PMC - PubMed

Publication types

LinkOut - more resources

  NODES
twitter 2