. 2009 Sep 29;48(38):9011-21.
doi: 10.1021/bi9003777.

Amyloid-beta(1-42) fibrillar precursors are optimal for inducing tumor necrosis factor-alpha production in the THP-1 human monocytic cell line

Affiliations

Amyloid-beta(1-42) fibrillar precursors are optimal for inducing tumor necrosis factor-alpha production in the THP-1 human monocytic cell line

Deepa Ajit et al. Biochemistry. .

Abstract

Pathological studies have determined that fibrillar forms of amyloid-beta protein (Abeta) comprise the characteristic neuritic plaques in Alzheimer's disease (AD). These studies have also revealed significant inflammatory markers such as activated microglia and cytokines surrounding the plaques. Although the plaques are a hallmark of AD, they are only part of an array of Abeta aggregate morphologies observed in vivo. Interestingly, not all of these Abeta deposits provoke an inflammatory response. Since structural polymorphism is a prominent feature of Abeta aggregation both in vitro and in vivo, we sought to clarify which Abeta morphology or aggregation species induces the strongest proinflammatory response using human THP-1 monocytes as a model system. An aliquot of freshly reconstituted Abeta(1-42) in sterile water (100 microM, pH 3.6) did not effectively stimulate the cells at a final Abeta concentration of 15 microM. However, quiescent incubation of the peptide at 4 degrees C for 48-96 h greatly enhanced its ability to induce tumor necrosis factor-alpha (TNFalpha) production, the level of which surprisingly declined upon further aggregation. Imaging of the Abeta(1-42) aggregation solutions with atomic force microscopy indicated that the best cellular response coincided with the appearance of fibrillar structures, yet conditions that accelerated or increased the level of Abeta(1-42) fibril formation such as peptide concentration, temperature, or reconstitution in NaOH/PBS at pH 7.4 diminished its ability to stimulate the cells. Finally, depletion of the Abeta(1-42) solution with an antibody that recognizes fibrillar oligomers dramatically weakened the ability to induce TNFalpha production, and size-exclusion separation of the Abeta(1-42) solution provided further characterization of an aggregated species with proinflammatory activity. The findings suggested that an intermediate stage Abeta(1-42) fibrillar precursor is optimal for inducing a proinflammatory response in THP-1 monocytes.


Figures

Figure 1
Figure 1
Dependence of the Aβ (1-42)-induced proinflammatory response on aggregation progression. Aβ(1-42) was reconstituted in sterile water (100 μM) and incubated at 4°C. At various time points, aliquots were removed and incubated with THP-1 monocytes for 6 h at a final Aβ(1-42) concentration of 15 μM. Secreted TNFα was measured in cell supernatants by ELISA. Lines 1-4 represent separate 100 μM Aβ(1-42) aggregation experiments. Line 1a (open circles) represents a 1.2 mM Aβ(1-42) aggregation solution incubated at 25°C prepared and tested within the same experiment as Line 1.
Figure 2
Figure 2
Morphological changes during Aβ-(1-42) aggregation time course. An Aβ(1-42) aggregation solution (100 μM) was prepared as described in Figure 1 and incubated at 4°C. Aliquots were removed, diluted to 1 μM in water, and imaged by AFM at 0 h (A), 48 h (C), and 216 h (D). DLS measurements were obtained of the 0 h solution as described in the Methods and a histogram of % mass vs. RH is shown in Panel B. A separate 1.2 mM Aβ(1-42) solution was prepared and imaged at 24 h (D). All AFM images are 5 μm × 5 μm and shown in “height” mode.
Figure 3
Figure 3
Increased incubation temperature accelerates Aβ(1-42) aggregation and reduces its ability to induce a proinflammatory response. A solution of Aβ(1-42) (100 μM) was separated into three tubes and each tube was incubated at different temperatures. At various times, aliquots were removed for both AFM imaging and treatment of the THP-1 monocytes as described in the Methods. Panels A-C. AFM images (5 μm × 5 μm) were obtained as described in Figure 2 from each Aβ(1-42) solution at 96 h prior to cell treatment. Images shown are representative of the solutions incubated at 4°C (A), 25°C (B), and 37°C (C). Panel D. Secreted TNFα levels (SE, n=3 measurements) were determined at each time point for Aβ(1-42) solutions incubated at 4°C (circles), 25°C (triangles), and 37°C (inverted triangles).
Figure 4
Figure 4
Monocyte viability is not compromised by aggregated Aβ(1-42). Aβ(1-42) solutions were prepared and incubated as in Fig. 1. At 72 h and 216 h of Aβ aggregation, THP-1 monocytes were treated with 15 μM Aβ(1-42) for 6 h. Cell viability was assessed using an XTT assay as described in the Methods. XTT reduction was determined by absorbance at 467nm for both control cells treated with sterile water vehicle (black bars) and Aβ-treated cells (hatched bars). Error bars for each condition represent standard error for n= 6 trials in 2 experiments. Absorbance values are presented as % of control cells for each experiment.
Figure 5
Figure 5
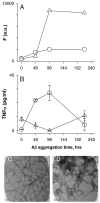
Ionic strength and pH influences Aβ-(1-42) proinflammatory activity. Two lyophylized Aβ(1-42) aliquots were reconstituted in either sterile water (circles) or 100 mM NaOH followed by 20-fold dilution into sterile phosphate-buffered saline (PBS) (triangles) at a concentration of 100 μM. Both solutions were incubated at 4°C. ThT-fluorescence was measured at different time points as described in the Methods (Panel A). For the same time points, THP-1 cells were treated with 15 μM Aβ(1-42) from each solution and secreted TNFα was measured in cell supernatants as in Figure 1 (Panel B). Error bars represent the standard error for n=3 trials. Panels C and D. Aliquots were removed from each sample at 96 h and imaged by TEM as described. Images are of Aβ(1-42) reconstituted in water (Panel C) or NaOH/PBS (Panel D). Scale bars represent 100 nm.
Figure 6
Figure 6
Aβ(1-40) is not as effective as Aβ(1-42) at inducing a proinflammatory response. Aβ(1-42) and Aβ(1-40) were reconstituted in sterile water at the same concentration (100 μM). Aβ(1-42) was incubated at 4°C (circles) while Aβ(1-40) was incubated at multiple temperatures. Aliquots were removed for both AFM imaging and incubation with THP-1 monocytes. Panels A-C. AFM images (5 μm × 5 μm) of Aβ(1-40) incubated at 4°C are shown for 0 (Panel A), 96 (Panel B), and 216 (Panel C) h. Panels D. TNFα production was measured as described and is plotted for Aβ(1-42) incubated at 4°C (circles) and Aβ(1-40) incubated at either 4°C (triangles), 25°C (inverted triangles), or 37°C (diamonds).
Figure 7
Figure 7
Solubility of the proinflammatory Aβ(1-42) species. Aβ(1-42) was reconstituted in sterile water (100 μM) and incubated at 4°C for 72 h. Separate aliquots of the same Aβ(1-42) solution was subjected to centrifugation for 1 h at 4°C at 100,000g and 150,000g. Equal volumes of the supernatants and the pre-centrifuge sample (total) were incubated with THP-1 monocytes for 24 h and secreted TNFα was measured as in Figure 1. AFM images (5 μm × 5 μm) were obtained for the pre-centrifuged total (Panel B) and the 150,000g supernatant (Panel C).
Figure 8
Figure 8
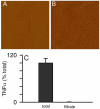
Filtering of Aβ(1-42) aggregation solution removes proinflammatory ability. Aβ(1-42) was reconstituted in sterile water (100 μM) and incubated at 4°C for 72 or 96 h. An aliquot from the solution was applied to a 0.2 μm PTFE centrifugal filter unit and centrifuged for 3 min at 12,000g at 4°C. AFM images (5 μm × 5 μm) were obtained for the pre-filter total (Panel A) and the filtrate (Panel B). Equal volumes of the pre-filter sample (total) and the filtrate were incubated with THP-1 monocytes for 6 h and secreted TNFα was measured as in Fig 1. TNFα is represented as a percentage of the TNFα induced by pre-filter sample. Secreted TNFα averaged 92 pg/ml in two experiments. Error bars represent the std error for n=6 measurements over two experiments.
Figure 9
Figure 9
Immunoprecipitation with OC antisera depletes fibrillar oligomers and fibrils from an Aβ(1-42) solution. Aβ(1-42) was reconstituted in sterile water (100 μM) and stored at 4°C for 72 h. The Aβ(1-42) solution was immunodepleted with OC antisera as described in the Methods and the remaining supernatant was re-examined by dot blot and AFM analysis. Panel A. Dot blot analysis of the 72 h Aβ(1-42) solution supernatant probed with OC antisera and Ab9 antibody following OC IP. Panels B-C. AFM images (5 μm × 5 μm) of untreated 72 h Aβ(1-42) solution (total) and the supernatant after immunodepletion with OC antisera (OC sup).
Figure 10
Figure 10
Immunodepletion with an anti-fibrillar oligomer antibody reduces the Aβ(1-42)-induced proinflammatory response. Aβ(1-42) was reconstituted in sterile water (100 μM) and stored at 4°C for 72 h. The Aβ(1-42) solution was immunodepleted with OC antisera or rabbit IgG as in Fig 9. The IP supernatants were then re-examined for OC-reactive species by dot blot analysis and also applied to THP-1 monocytes. Panel A. Dot blot probed with OC antisera of the 72 h Aβ(1-42) 18,000g centrifugation supernatant (tot sup), OC IP supernatant (OC IP sup), and rabbit IgG IP supernatant (IgG IP sup). Panel B. Equal volumes of untreated 72 h Aβ(1-42) solution (tot) and 18,000g centrifugation supernatant (tot sup), and the OC- and rabbit IgG-immunodepleted supernatant (OC IP sup and IgG IP sup) were incubated with THP-1 monocytes for 24 h and secreted TNFα was measured as in Fig 1.
Figure 11
Figure 11
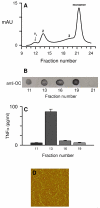
SEC-separation of aggregated Aβ(1-42). Aβ(1-42) reconstituted in sterile water was allowed to incubate for 96 h at 4°C before centrifugation at 18,000g and separation of the supernatant on a Superdex 75 column as described in the Methods. Panel A. 280 nm absorbance elution profile of aggregated Aβ(1-42)/water solution. Tick marks for fractions (0.5 ml) represent the beginning of elution collection for each fraction tube. Aβ concentrations determined by absorbance for the peak maximums were 1.4 μM for the void volume (Vo) and 5.7 μM, 3.5 μM, and 18.3 μM for the included volumes (peak 2, 3, and monomer respectively). Panel B. Dot blot probed with OC-antisera for the fractions listed above (without dilution). Panel C. THP-1 monocytes were treated with 90 μl from the OC-positive fractions in a total volume of 300 μl for 6 h at 37°C and TNFα production was measured as in Figure 1. Panel D. AFM height mode image (3 μm × 3 μm) of a fraction from SEC-separated included peak 2 prepared without dilution.

Similar articles

Cited by

References

    1. Selkoe DJ. Cell biology of protein misfolding: The examples of Alzheimer’s and Parkinson’s diseases. Nat Cell Biol. 2004;6:1054–1061. - PubMed
    1. Selkoe DJ. The cell biology of β-amyloid precursor protein and presenilin in Alzheimer’s disease. Trends Cell Biol. 1998;8:447–453. - PubMed
    1. McGeer PL, Itagaki S, Tago H, McGeer EG. Reactive microglia in patients with senile dementia of the Alzheimer type are positive for the histocompatibility glycoprotein HLA-DR. Neurosci. Lett. 1987;79:195–200. - PubMed
    1. Meyer-Luehmann M, Spires-Jones TL, Prada C, Garcia-Alloza M, de Calignon A, Rozkalne A, Koenigsknecht-Talboo J, Holtzman DM, Bacskai BJ, Hyman BT. Rapid appearance and local toxicity of amyloid-β plaques in a mouse model of Alzheimer’s disease. Nature. 2008;451:720–724. - PMC - PubMed
    1. Dickson DW, Lee SC, Mattiace LA, Yen SHC, Brosnan C. Microglia and cytokines in neurological disease, with special reference to AIDS and Alzheimer disease. Glia. 1993;7:75–83. - PubMed

Publication types

MeSH terms

  NODES
twitter 2