. 2009 Oct 8;461(7265):819-22.
doi: 10.1038/nature08448. Epub 2009 Sep 27.

JAK2 phosphorylates histone H3Y41 and excludes HP1alpha from chromatin

Affiliations

JAK2 phosphorylates histone H3Y41 and excludes HP1alpha from chromatin

Mark A Dawson et al. Nature. .

Abstract

Activation of Janus kinase 2 (JAK2) by chromosomal translocations or point mutations is a frequent event in haematological malignancies. JAK2 is a non-receptor tyrosine kinase that regulates several cellular processes by inducing cytoplasmic signalling cascades. Here we show that human JAK2 is present in the nucleus of haematopoietic cells and directly phosphorylates Tyr 41 (Y41) on histone H3. Heterochromatin protein 1alpha (HP1alpha), but not HP1beta, specifically binds to this region of H3 through its chromo-shadow domain. Phosphorylation of H3Y41 by JAK2 prevents this binding. Inhibition of JAK2 activity in human leukaemic cells decreases both the expression of the haematopoietic oncogene lmo2 and the phosphorylation of H3Y41 at its promoter, while simultaneously increasing the binding of HP1alpha at the same site. Tauhese results identify a previously unrecognized nuclear role for JAK2 in the phosphorylation of H3Y41 and reveal a direct mechanistic link between two genes, jak2 and lmo2, involved in normal haematopoiesis and leukaemia.


Figures
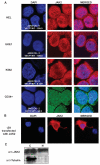
Figure 1
Figure 1. JAK2 is present in the nucleus of haematopoietic cells
(A) Confocal laser scanned images of asynchronous cells demonstrate that JAK2 has a nuclear subcellular localisation in haematopoietic cell lines and primary CD34+ peripheral blood stem cells (CD34+). CN indicates copy number of JAK2 and V617F:WT represents the ratio of JAK2 V617F to JAK2 wildtype for each cell type. Two primary anti-JAK2 antibodies were used for the IF images (Cell Signalling, (cat. no. D2E12 #3230) shown in red, and Imgenex (cat. no IMG-3007) shown in green). The two JAK2 antibodies recognize different JAK2 epitopes (detailed in Materials and Methods and supplementary figure 2C). Representative images from experiments performed on three occasions are shown. Images were captured with a X40 oil immersion lens. (B) Confocal laser scanned images of JAK2-null (γ2A) cells transfected with JAK2. The field of view shown was chosen because it contains a JAK2 transfected cell and an untransfected cell highlighting the specificity of the JAK2 antibody as JAK2 is only detected in transfected cells. Again, JAK2 is detected in the nucleus. (C) Biochemical evidence of nuclear JAK2 in HEL cells. Cells were fractionated into cytoplasmic (C) and nuclear extracts (N). Western blotting analysis demonstrates that JAK2 is present in both cellular compartments, however β-tubulin (anti-Tubulin) is confined to the cytoplasmic fraction and testifies to the purity of the cell fractionation.
Figure 2
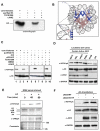
Figure 2. JAK2 phosphorylates H3Y41 in vitro and in vivo
(A) A mixture of core histones or purified histone H3 from calf thymus were used as substrate in an in vitro kinase assay using γ32P-ATP and recombinant JAK2 (rJAK2). In this assay rJAK2 specifically phosphorylates H3 and its activity is annulled by 10 nM of the JAK2 inhibitor TG101209. (B) Histone H3 (blue) is shown in the nucleosome. The inset image highlights that H3Y41 is positioned at the N-terminus of the first helix of H3 (the αN1-helix) where the DNA enters the nucleosome, and it is juxtaposed to the major groove of the DNA double helix. Images were constructed using Macpymol software. (C) In vitro kinase assay followed by western blot analysis using the H3Y41ph antibody demonstrates that the antibody detects the site of phosphorylation by rJAK2 on core histones, purified H3 and bacterially synthesised recombinant H3 (rH3). Notably, the signal is virtually absent when recombinant H3Y41F mutant (rH3Y41F) is used as the substrate. The kinase activity is markedly attenuated by 10 nM of TG101209 diluted in dimethyl sulfoxide (DMSO). In contrast, an equal quantity of DMSO alone has no inhibitory activity on rJAK2. As a loading control, H3 is shown following western blotting of the reactions with an anti-H3 antibody (α-H3). (D) Chromatin was prepared from the indicated cell lines and the level of H3Y41ph was determined by western blot. The H3Y41ph antibody detects higher levels of H3Y41 phosphorylation in the cell lines containing active JAK2. Equal loading of histones was confirmed by western blotting for histone H3 (α-H3). JAK2 protein expression was analysed in whole cell extracts from the above cell lines confirming its absence in HL60 and γ2a cells (α-JAK2), and equal loading of the whole cell extracts was confirmed by western blotting for GAPDH (α-GAPDH). (E) Following serum starvation for 72 hours, K562 cells were stimulated with LIF for up to 90 minutes. The levels of H3Y41ph and phospho-JAK2 (α-JAK2ph) were determined by western blot analyses of whole cell extracts. The H3Y41ph and phospho-JAK2 antibodies demonstrate higher levels of phosphorylation following cytokine induction with LIF at both 45 and 90 minutes. Coomassie-blue staining of the probed extracts demonstrates equal loading of both histones and higher molecular weight proteins. (F) Chromatin was prepared from γ2A cells that were transfected with JAK2 WT, JAK2 V617F or empty vector and the level of H3Y41ph was determined by western blot analysis. H3Y41 phosphorylation is higher in γ2A cells transfected with JAK2 (wild type and V617F mutant). Equal loading of histones was confirmed by western blotting for histone H3 (α-H3). JAK2 protein (α-JAK2) was monitored in whole cell extracts from the same cells and its expression was detected only in JAK2 transfected γ2a cells. Equal loading of the whole cell extracts was confirmed by western blotting for GAPDH (α-GAPDH). (G) HEL cells were grown in the presence of a specific JAK2 inhibitor (TG101209) or DMSO (vehicle control) for the indicated times. Chromatin extracts were prepared and analysed by western blot analysis. These data demonstrate that H3Y41 phosphorylation (α-H3Y41ph) is markedly reduced within minutes of JAK2 inhibition. Equal loading of the extracts was demonstrated using an anti-histone H3 antibody (α-H3). (H) The changes observed above were quantitated using Image J (National Institutes of Health, USA) software. Similar results were noted with a second specific JAK2 inhibitor (AT9283), data not shown. All blots shown are representative images of experiments conducted on at least 3 occasions.
Figure 3
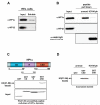
Figure 3. HP1α binds the Y41 region of H3 in a phosphorylation-dependent manner
(A) Permeabilised nuclei were prepared from HEL cells and separated into soluble and chromatin bound fractions. The soluble fraction was analysed by western blotting for HP1α and HP1β. As identical fractions were analysed for both HP1α and HP1β, this provides an internal control for any variation in loading. These data demonstrate that a higher percentage of HP1α is present in the soluble phase compared to HP1β. Input represents the total HP1 (chromatin bound and soluble fraction) present in an identical amount of nuclei prior to fractionation. (B) HP1α, HP1β and H3Y41ph antibody were tested for their ability to bind either the unmodified H3(31-56) peptides (unmod) or identical peptides phosphorylated at H3Y41 (H3Y41ph) immobilized on sepharose beads. Following binding, the products were resolved by SDS-PAGE, western blotted and probed for HP1α, HP1β and rabbit IgG (to detect H3Y41ph antibody). The data show that HP1α, but not HP1β, binds the unmodified region of H3(31-56) and that this binding is severely abrogated by phosphorylation of H3Y41. The binding of the H3Y41ph antibody to only the modified peptide demonstrates the integrity of this affinity matrix and the specificity of the assay. (C) A schematic diagram of HP1α shows three characterized domains; chromodomain (CD), Hinge (H) and chromoshadow domain (CSD) of HP1α. Also shown are the amino acid (numbered) boundaries of each domain. The indicated regions, encompassing each domain, were cloned separately into pGex vector to allow expression of the three HP1α domains as separate GST-fusions. An equal amount of GST, GST-CD, GST-H and GST-CSD were tested for their ability to bind unmodified H3(31-56) peptides (unmod) immobilized on beads. Following binding, the products were resolved by SDS-PAGE. The resulting Coomassie Blue stained gel is shown. Input shows the quantity of GST-fusions used in the pull-down assay. The data show that only the CSD of HP1α binds the unmodified region of H3 (31-56). (D) Unmodified H3(31-56) peptides (unmod) or identical peptides phosphorylated at H3Y41 (H3Y41ph) were immobilized on beads and used to test the binding of the HP1α CSD to this region of H3. The data show that the HP1α CSD binding to H3(31-56) is severely abrogated by phosphorylation of H3Y41. (E) HL60 cells were permeabilised and HP1α binding to chromatin was challenged by competition with the indicated peptides. HP1α localization was then visualized using standard immmunofluorescence methodology. Peptides used were; unmodified H3(31-56) [H3(31-56)un], the same peptide but phosphorylated at Y41 (H3(31-56)Y41ph), and a H3 peptide trimethylated at H3K9 (H3K9me3(1-21)). HP1α is displaced from heterochromatic speckles by the H3(31-56) and H3K9me3 peptides suggesting that HP1α can bind both these regions of H3 independently. In contrast, challenge with H3Y41ph peptide [H3Y41ph(31-56)] failed to show significant disruption of HP1α when compared to unchallenged cells. (F) The degree of HP1α displacement observed in panel E was quantitated according to the mean pixel count of the red fluorochrome (representing HP1α) present within the nuclei of cells following peptide challenge. The mean pixel count, standard deviation of the mean pixel count (error bars) and the number of cells counted (n = X) are plotted demonstrating that in comparison to unchallenged cells only the H3(31-56) unmodified peptide and the H3K9me3 peptide significantly displace the nuclear localization of HP1α. (G) HEL cells were treated with vehicle alone (DMSO) or a specific JAK2 inhibitor (TG101209 or AT9283 at their cellular IC50s). Permeabilised nuclei were then prepared and challenged with 0.75 ng/ml of the H3K9me3 peptide, an amount sufficient to disassociate a relatively small percentage of HP1α form chromatin. Chromatin and soluble fractions were then subjected to SDS-PAGE, western blotted and probed for HP1α and H3K9me. The data demonstrate that HP1α is bound more avidly to chromatin following JAK2 inhibition and that this increased avidity for chromatin is not accounted for by detectable changes in H3K9 methylation. All data demonstrated are representative of experiments performed on at least three occasions.
Figure 4
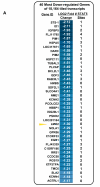
Figure 4. JAK2 signaling regulates the expression of the lmo2 oncogene
(A) HEL cells were treated for four hours with either TG101209 JAK2 inhibitor or DMSO (vehicle) alone. From these cells, mRNA and chromatin (used in B, below) were prepared. The mRNA from two biological replicates was used to generate a gene expression profile. The forty most down-regulated genes are illustrated. Lmo2 is highlighted as a major _target of JAK2 signaling. The number of potential STAT5 DNA binding sites in each locus is indicated. These were determined using an algorithm that searches at low stringency for STAT5 binding sites. (B) Chromatin prepared from the cells used to generate the gene expression profile (panel A) was used in chromatin immunoprecipitation (ChIP) analyses followed by real-time PCR analysis. Five regions within the lmo2 locus were investigated (amplicons 1 to 5; see schematic representation of lmo2 locus) using antibodies against HP1α, H3Y41ph and H3K4me3 (a histone modification associated with gene activity). Two regions, one spanning the lmo2 promoter and one spanning the transcriptional start site (amplicons 3 to 5) show a decrease in H3Y41ph and H3K4me3 following JAK2 inhibition. Importantly, these changes are associated with a reciprocal and significant increase in HP1α. In contrast, there are no changes seen at a region 1.25kb upstream to the lmo2 promoter (amplicon 1) at a site not known to be involved with the transcriptional control of the lmo2 gene. The data have been normalized for H3 occupancy (by performing an anti-H3 ChIP) and is displayed as the fold change observed after JAK2-inhibition with TG101209 for 4 hours. A representative example of a ChIP analysis performed on at least three biological replicates is shown. Each amplicon was analysed in duplicate each time and error bars represent the standard deviation for each amplicon. (C) Schematic model depicting the reduction in HP1α binding to chromatin following phosphorylation of H3Y41 by JAK2. On the left are the known functions of HP1α whilst on the right are the known consequences of dysregulated JAK2 seen as a feature in JAK2 mediated haematological malignancies. Our model suggests a role in the regulation of oncogene expression (lmo2) and raises the possibility that other phenotypic consequences of JAK2 associated malignancies such as mitotic recombination and chromosomal dysjunction may be accounted for by constitutively active JAK2 phosphorylating H3Y41 leading to the uncontrolled displacement of HP1α.

Similar articles

Cited by

References

    1. Campbell PJ, Green AR. N Engl J Med. 2006;355(23):2452. - PubMed
    1. Levine RL, Pardanani A, Tefferi A, et al. Nat Rev Cancer. 2007;7(9):673. - PubMed
    1. Lacronique V, Boureux A, Valle VD, et al. Science. 1997;278(5341):1309. - PubMed
    1. Scott LM, Tong W, Levine RL, et al. N Engl J Med. 2007;356(5):459. - PMC - PubMed
    1. Bercovich D, Ganmore I, Scott LM, et al. Lancet. 2008

Publication types

MeSH terms

  NODES
INTERN 2
Note 2
twitter 2