Genetic analysis of potassium use efficiency in Brassica oleracea
- PMID: 19815571
- PMCID: PMC2887060
- DOI: 10.1093/aob/mcp253
Genetic analysis of potassium use efficiency in Brassica oleracea
Abstract
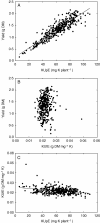
Background and aims: Potassium (K) fertilizers are used in intensive and extensive agricultural systems to maximize production. However, there are both financial and environmental costs to K-fertilization. It is therefore important to optimize the efficiency with which K-fertilizers are used. Cultivating crops that acquire and/or utilize K more effectively can reduce the use of K-fertilizers. The aim of the present study was to determine the genetic factors affecting K utilization efficiency (KUtE), defined as the reciprocal of shoot K concentration (1/[K](shoot)), and K acquisition efficiency (KUpE), defined as shoot K content, in Brassica oleracea.
Methods: Genetic variation in [K](shoot) was estimated using a structured diversity foundation set (DFS) of 376 accessions and in 74 commercial genotypes grown in glasshouse and field experiments that included phosphorus (P) supply as a treatment factor. Chromosomal quantitative trait loci (QTL) associated with [K](shoot) and KUpE were identified using a genetic mapping population grown in the glasshouse and field. Putative QTL were tested using recurrent backcross substitution lines in the glasshouse.
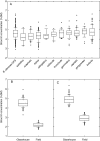
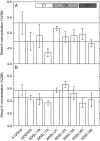
Key results: More than two-fold variation in [K](shoot) was observed among DFS accessions grown in the glasshouse, a significant proportion of which could be attributed to genetic factors. Several QTL associated with [K](shoot) were identified, which, despite a significant correlation in [K](shoot) among genotypes grown in the glasshouse and field, differed between these two environments. A QTL associated with [K](shoot) in glasshouse-grown plants (chromosome C7 at 62.2 cM) was confirmed using substitution lines. This QTL corresponds to a segment of arabidopsis chromosome 4 containing genes encoding the K+ transporters AtKUP9, AtAKT2, AtKAT2 and AtTPK3.
Conclusions: There is sufficient genetic variation in B. oleracea to breed for both KUtE and KUpE. However, as QTL associated with these traits differ between glasshouse and field environments, marker-assisted breeding programmes must consider carefully the conditions under which the crop will be grown.
Figures


Similar articles
-
Shoot calcium and magnesium concentrations differ between subtaxa, are highly heritable, and associate with potentially pleiotropic loci in Brassica oleracea.Plant Physiol. 2008 Apr;146(4):1707-20. doi: 10.1104/pp.107.114645. Epub 2008 Feb 15. Plant Physiol. 2008. PMID: 18281414 Free PMC article.
-
Shoot yield drives phosphorus use efficiency in Brassica oleracea and correlates with root architecture traits.J Exp Bot. 2009;60(7):1953-68. doi: 10.1093/jxb/erp083. Epub 2009 Apr 3. J Exp Bot. 2009. PMID: 19346243
-
Identification of QTLs associated with potassium use efficiency and underlying candidate genes by whole-genome resequencing of two parental lines in Brassica napus.Genomics. 2021 Mar;113(2):755-768. doi: 10.1016/j.ygeno.2021.01.020. Epub 2021 Jan 29. Genomics. 2021. PMID: 33516850
-
Genetic dissection of root morphological traits as related to potassium use efficiency in rapeseed under two contrasting potassium levels by hydroponics.Sci China Life Sci. 2019 Jun;62(6):746-757. doi: 10.1007/s11427-018-9503-x. Epub 2019 May 5. Sci China Life Sci. 2019. PMID: 31069628 Review.
-
Crop management impacts the efficiency of quantitative trait loci (QTL) detection and use: case study of fruit load×QTL interactions.J Exp Bot. 2014 Jan;65(1):11-22. doi: 10.1093/jxb/ert365. Epub 2013 Nov 13. J Exp Bot. 2014. PMID: 24227339 Review.
Cited by
-
Opening the Treasure Chest: The Current Status of Research on Brassica oleracea and B. rapa Vegetables From ex situ Germplasm Collections.Front Plant Sci. 2021 May 20;12:643047. doi: 10.3389/fpls.2021.643047. eCollection 2021. Front Plant Sci. 2021. PMID: 34093606 Free PMC article. Review.
-
Matching roots to their environment.Ann Bot. 2013 Jul;112(2):207-22. doi: 10.1093/aob/mct123. Ann Bot. 2013. PMID: 23821619 Free PMC article.
-
Genetic dissection of the shoot and root ionomes of Brassica napus grown with contrasting phosphate supplies.Ann Bot. 2020 Jun 19;126(1):119-140. doi: 10.1093/aob/mcaa055. Ann Bot. 2020. PMID: 32221530 Free PMC article.
-
Recent progress in the use of 'omics technologies in brassicaceous vegetables.Front Plant Sci. 2015 Apr 14;6:244. doi: 10.3389/fpls.2015.00244. eCollection 2015. Front Plant Sci. 2015. PMID: 25926843 Free PMC article. Review.
-
QTL mapping for seedling traits in wheat grown under varying concentrations of N, P and K nutrients.Theor Appl Genet. 2012 Mar;124(5):851-65. doi: 10.1007/s00122-011-1749-7. Epub 2011 Nov 17. Theor Appl Genet. 2012. PMID: 22089330
References
-
- Akhtar MS, Oki Y, Adachi T, Murata Y, Khan MHR. Phosphorus starvation induced root-mediated pH changes in solubilization and acquisition of sparingly soluble P sources and organic acids exudation by Brassica cultivars. Soil Science and Plant Nutrition. 2006;52:623–633.
-
- Akhtar MS, Oki Y, Adachi T. Genetic variability in phosphorus acquisition and utilization efficiency from sparingly soluble P-sources by Brassica cultivars under P-stress environment. Journal of Agronomy and Crop Science. 2008;194:380–392.
-
- Baligar VC, Fageria NK, He ZL. Nutrient use efficiency in plants. Communications in Soil Science and Plant Analysis. 2001;32:921–950.
-
- Bettey M, Finch-Savage WE, King GJ, Lynn JR. Quantitative genetic analysis of seed vigour and pre-emergence seedling growth traits in Brassica oleracea. New Phytologist. 2000;148:277–286.
Publication types
MeSH terms
Substances
Grants and funding
LinkOut - more resources
Full Text Sources
Medical
Miscellaneous

