. 2010 Mar 19;285(12):9249-61.
doi: 10.1074/jbc.M109.083725. Epub 2010 Jan 12.

A Coronin7 homolog with functions in actin-driven processes

Affiliations

A Coronin7 homolog with functions in actin-driven processes

Maria C Shina et al. J Biol Chem. .

Abstract

Dictyostelium discoideum Coronin7 (DdCRN7) together with human Coronin7 (CRN7) and Pod-1 of Drosophila melanogaster and Caenorhabditis elegans belong to the coronin family of WD-repeat domain-containing proteins. Coronin7 proteins are characterized by two WD-repeat domains that presumably fold into two beta-propeller structures. DdCRN7 shares highest homology with human CRN7, a protein with roles in membrane trafficking. DdCRN7 is present in the cytosol and accumulates in cell surface projections during movement and phago- and pinocytosis. Cells lacking CRN7 have altered chemotaxis and phagocytosis. Furthermore, loss of CRN7 affects the infection process by the pathogen Legionella pneumophila and allows a more efficient internalization of bacteria. To provide a mechanism for CNR7 action, we studied actin-related aspects. We could show that CRN7 binds directly to F-actin and protects actin filaments from depolymerization. CRN7 also associated with F-actin in vivo. It was present in the Triton X-100-insoluble cytoskeleton, colocalized with F-actin, and its distribution was sensitive to drugs affecting the actin cytoskeleton. We propose that the CRN7 role in chemotaxis and phagocytosis is through its effect on the actin cytoskeleton.


Figures
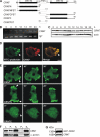
FIGURE 1.
FIGURE 1.
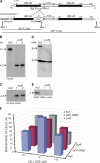
Expression and distribution of CRN7. A, shown is a diagram depicting the domain organization of CRN7 (dictyBase gene number DDB0190225) and GFP-tagged truncated CRN7 proteins. The corresponding amino acid positions are given. B and C, shown is CRN7 transcript and protein accumulation during development (in hours). RNA was analyzed by reverse transcription-PCR. The loading control in B is Ig7, a constitutively expressed mitochondrial rRNA. For Western blot analysis whole cell homogenates (2 × 10⁵ cells per lane) were probed with mAb K67-146-1. Actin detected with mAb act1–7 is shown for control. D, CRN7 colocalizes with F-actin. CRN7 was detected with mAb K67-31-5 and F-actin with fluorescein isothiocyanate (FITC) phalloidin. Fixation was done using paraformaldehyde. Bar, 3 μm. E, shown is localization of GFP-tagged full-length CRN7 and GFP-tagged CRN7 domains analyzed by live-cell imaging. Arrowheads indicate accumulation of the proteins at macro- and pinocytic cups and in the leading front. F, shown is subcellular fractionation. CRN7 was detected with mAb K67-146-1; α-actinin was used for control. L, lysate; P1 and S1, supernatant and pellet fraction, respectively, after 10,000 × g spin; P2 and S2, supernatant and pellet fraction, respectively, after 100,000 × g spin. G, a Western blot analysis shows the levels of endogenous and GFP-tagged CRN7 using monoclonal antibody K67-146-1.
FIGURE 2.
FIGURE 2.
Generation of CRN7-deficient mutants (corB). A, a replacement vector was constructed by replacing an internal 250-bp BglII/XbaI fragment of the corB gene with the blasticidin resistance cassette (bsr). The location of relevant restriction enzyme sites and of the probes used for Southern blot analysis is given. B and C, Southern blot analysis is shown of SpeI-digested genomic DNA of Ax2 and corB cells. Successful insertion of the replacement vector reveals a shift from 15 kb for wild type to 4.3 kb after digestion with SpeI due to the introduction of an additional SpeI site into the corB locus by the bsr cassette. The gene replacement was revealed with a 5′ probe and a bsr-specific probe. D and E, Western and Northern blot analysis shows the absence of protein and transcript in mutant cells. A CRN7-specific probe corresponding to a sequence encoding amino acids 1–332 was used for Northern blot analysis. The Western blots were labeled with mAb K67-146-1 for CRN7 and act 1–7 for actin for control. F, cell size was determined by measuring more than 300 cells with ImageJ. The mutant shows a slight decrease in cell size compared with wild type cells.
FIGURE 3.
FIGURE 3.
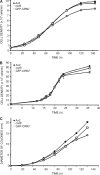
Growth behavior of corB cells. A, growth in axenic medium is altered. 2 × 10⁵ cells/ml were used for inoculation. Over a period of 8–10 days, the cells were counted. The mutant cell line did not reach the same final density at the stationary phase as Ax2. B, the mutant cell line grown with E. coli B/r in shaking suspension also did not reach the same final density as Ax2. C, mutant cells plated with Klebsiella on SM plates displayed colonies smaller in diameter than wild type. The experiments were carried out more than six times. The independent experimental data were averaged and are depicted in the diagram. The error bars are very small and can hardly be seen.
FIGURE 4.
FIGURE 4.
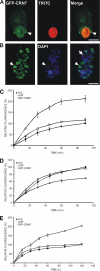
CRN7 role in phagocytosis. A and B, GFP-CRN7 distribution during phagocytosis of yeast and E. coli cells is shown. Cells were fed with TRITC-labeled yeast (A) or E. coli (B) and fixed. Bacteria added in a 1:500 excess were stained with 4′,6-diamidino-2-phenylindole (DAPI). Confocal images were taken from green and red channels that were independently assigned and then overlaid. The arrowheads point to an accumulation of GFP-CRN7 in the initial steps of yeast phagocytosis (A) and to bacteria surrounded by GFP-CRN7 (B). The arrow indicates internalized bacteria devoid of a GFP-CRN7 coat. C and D, quantitative analysis of TRITC-labeled yeast and latex beads (1 μm) uptake is shown. Cells were resuspended at 2 × 10⁶ cells/ml in fresh axenic medium, and a 6-fold excess of fluorescent yeast cells and a 200-fold excess of labeled latex beads were added (24). Fluorescence of the internalized marker was measured at selected time points. Data are presented as relative fluorescence to that of Ax2, considered as 100%. E, shown is internalization of rhodamine-labeled L. pneumophila with an m.o.i. of 10. The phagocytosis protocol for latex beads was used. Each experiment was carried out more than six times, and the data depicted in the diagram are averaged.
FIGURE 5.
FIGURE 5.
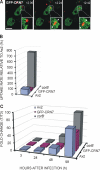
Infection of coronin mutants with L. pneumophila. A, shown are GFP-CRN7-expressing cells infected with L. pneumophila (m.o.i. 5). During infection GFP-CRN7-expressing cells were monitored by live cell imaging (images were taken every 18 s). The arrowheads (inset) point to an ingested L. pneumophila with (12.24-min time point) and without (12.42-min time point) a GFP-CRN7 coat. B, shown is the course of infection at early time points in Ax2, corB, and GFP-CRN7 overexpressing strain. Graphs represent the mean values and S.D. of three independent experiments performed twice for each strain, except for Ax2 (GFP-CRN7), where two independent experiments were performed. C, replication of L. pneumophila over 4 days was assayed in wild type Ax2, corB, and Ax2 GFP-CRN7 overexpressing cells. Fold change values were calculated by normalization with T3, the value obtained at time point 3 h post-infection. Bar, 8 μm.
FIGURE 6.
FIGURE 6.
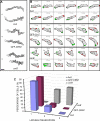
Chemotactic movement of corB cells. A, shown are computer-generated cell tracks and stack images of corB and Ax2-expressing GFP-CRN7 in comparison to Ax2. Aggregation-competent cells were deposited on coverslips and after settling down challenged with cAMP. The star indicates the location of the pipette filled with cAMP. The cell perimeters were outlined and are shown for two representative cells each. Bar, 8 μm. B, cell shape changes of aggregation-competent cells were analyzed by DIAS software. Images were taken every 10 s. The outlines were traced manually, and the changes of direction (arrows) were calculated using the DIAS image analysis software. The green areas indicate new membrane protrusions, and the red areas indicate retractions. C, shown is lateral pseudopod formation of wild type and mutant cell line. Arising lateral pseudopods were counted from more than 60 single cells of each cell line monitored during the first 10 min while migrating in a cAMP gradient.
FIGURE 7.
FIGURE 7.
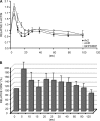
CRN7 effect on actin polymerization. A, F-actin polymerization response upon cAMP stimulation is shown. Samples were taken at the indicated time points after stimulation with 1 μm cAMP. The amount of F-actin was normalized relative to the F-actin level of unstimulated cells. The relative F-actin content was determined by fluorimetric measurements of TRITC-phalloidin. The data are the average of six independent experiments for each cell line. B, shown is association of CRN7 with the actin cytoskeleton upon a cAMP stimulus. A maximum increase in protein levels of endogenous CRN7 was observed after 5 s of stimulation corresponding to the F-actin changes. The data represent the average of seven independent experiments.
FIGURE 8.
FIGURE 8.
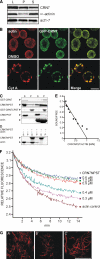
Association of CRN7 with F-actin. A, Triton X-100-insoluble cytoskeletons of Ax2 cells are shown. CRN7 was detected with mAb K67-146-1. α-actinin and actin were used for a control. Detection was with mAb 47-16-1 and act1–7, respectively. L, lysate; P, Triton-insoluble pellet; S, supernatant. B, GFP-CRN7 distribution is sensitive to drugs that affect the actin cytoskeleton. Incubation with cytochalasin A (Cyt A, 20 μm) was for 30 min. DMSO represents the solvent control. GFP-CRN7-expressing cells were fixed and stained with mAb act 1–7. Bar, 8 μm. Co-sedimentation of CRN7 polypeptides with actin is shown. C, full-length CRN7 (GST-CRN7) and different CRN7 polypeptides (CRN7NPST, GST-CRN7CPST, CRN7PST) and actin were copolymerized and centrifuged at 100,000 × g, and the pellets were solubilized in the original volume. The first two lanes show the sedimentation of the recombinant proteins in the absence of actin, and the second two lanes show the experiment with actin added. The experiments were carried out in parallel; the actin sedimentation is shown only once. D, low speed sedimentation of F-actin polymerized in the presence of CRN7NPST and centrifuged at 15,000 × g for 30 min. All supernatants (S) and pellets (P) were subjected to and analyzed by SDS-PAGE. E, a Scatchard plot evaluates the molar ratio of binding of CRN7NPST to actin. Ratios from 0.2:1 to 2:1 (CRN7NPST to actin) were used in the experiment. Coomassie Blue-stained gels were scanned and quantified with ImageJ. F, shown is a dilution-induced F-actin depolymerization assay. Increasing concentrations of CRN7NPST were used. Pyrene-labeled F-actin was diluted below the critical concentration of the minus end, and the fluorescence decrease was monitored. G, shown is polymerization of actin filaments on coverslips stained with TRITC-phalloidin and incubated alone (A′), with bovine serum albumin (B′), and CRN7NPST in a molar ratio of 1:1 (C′). Bar, 1 μm.

Similar articles

Cited by

References

    1. Appleton B. A., Wu P., Wiesmann C. (2006) Structure 14, 87–96 - PubMed
    1. Goode B. L., Wong J. J., Butty A. C., Peter M., McCormack A. L., Yates J. R., Drubin D. G., Barnes G. (1999) J. Cell Biol. 144, 83–98 - PMC - PubMed
    1. de Hostos E. L., Bradtke B., Lottspeich F., Guggenheim R., Gerisch G. (1991) EMBO J. 10, 4097–4104 - PMC - PubMed
    1. de Hostos E. L., Rehfuess C., Bradtke B., Waddell D. R., Albrecht R., Murphy J., Gerisch G. (1993) J. Cell Biol. 120, 163–173 - PMC - PubMed
    1. Maniak M., Rauchenberger R., Albrecht R., Murphy J., Gerisch G. (1995) Cell 83, 915–924 - PubMed

Publication types

LinkOut - more resources

  NODES
Association 4
INTERN 5
Project 1
twitter 2