Rearrangement of CRLF2 is associated with mutation of JAK kinases, alteration of IKZF1, Hispanic/Latino ethnicity, and a poor outcome in pediatric B-progenitor acute lymphoblastic leukemia
- PMID: 20139093
- PMCID: PMC2902132
- DOI: 10.1182/blood-2009-09-245944
Rearrangement of CRLF2 is associated with mutation of JAK kinases, alteration of IKZF1, Hispanic/Latino ethnicity, and a poor outcome in pediatric B-progenitor acute lymphoblastic leukemia
Abstract
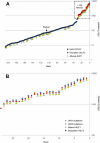
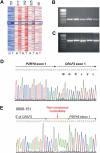
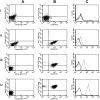
Gene expression profiling of 207 uniformly treated children with high-risk B-progenitor acute lymphoblastic leukemia revealed 29 of 207 cases (14%) with markedly elevated expression of CRLF2 (cytokine receptor-like factor 2). Each of the 29 cases harbored a genomic rearrangement of CRLF2: 18 of 29 (62%) had a translocation of the immunoglobulin heavy chain gene IGH@ on 14q32 to CRLF2 in the pseudoautosomal region 1 of Xp22.3/Yp11.3, whereas 10 (34%) cases had a 320-kb interstitial deletion centromeric of CRLF2, resulting in a P2RY8-CRLF2 fusion. One case had both IGH@-CRLF2 and P2RY8-CRLF2, and another had a novel CRLF2 rearrangement. Only 2 of 29 cases were Down syndrome. CRLF2 rearrangements were significantly associated with activating mutations of JAK1 or JAK2, deletion or mutation of IKZF1, and Hispanic/Latino ethnicity (Fisher exact test, P < .001 for each). Within this cohort, patients with CRLF2 rearrangements had extremely poor treatment outcomes compared with those without CRLF2 rearrangements (35.3% vs 71.3% relapse-free survival at 4 years; P < .001). Together, these observations suggest that activation of CRLF2 expression, mutation of JAK kinases, and alterations of IKZF1 cooperate to promote B-cell leukemogenesis and identify these pathways as important therapeutic _targets in this disease.
Trial registration: ClinicalTrials.gov NCT00005603.
Figures


Similar articles
-
Outcome modeling with CRLF2, IKZF1, JAK, and minimal residual disease in pediatric acute lymphoblastic leukemia: a Children's Oncology Group study.Blood. 2012 Apr 12;119(15):3512-22. doi: 10.1182/blood-2011-11-394221. Epub 2012 Feb 24. Blood. 2012. PMID: 22368272 Free PMC article.
-
IKZF1 and CRLF2 gene alterations correlate with poor prognosis in Japanese BCR-ABL1-negative high-risk B-cell precursor acute lymphoblastic leukemia.Pediatr Blood Cancer. 2013 Oct;60(10):1587-92. doi: 10.1002/pbc.24571. Epub 2013 Jun 27. Pediatr Blood Cancer. 2013. PMID: 23804397 Clinical Trial.
-
IKZF1 deletion is associated with a poor outcome in pediatric B-cell precursor acute lymphoblastic leukemia in Japan.Cancer Med. 2013 Jun;2(3):412-9. doi: 10.1002/cam4.87. Epub 2013 May 9. Cancer Med. 2013. PMID: 23930217 Free PMC article.
-
CRLF2 and JAK2 in B-progenitor acute lymphoblastic leukemia: a novel association in oncogenesis.Cancer Res. 2010 Oct 1;70(19):7347-52. doi: 10.1158/0008-5472.CAN-10-1528. Epub 2010 Aug 31. Cancer Res. 2010. PMID: 20807819 Free PMC article. Review.
-
The molecular genetic makeup of acute lymphoblastic leukemia.Hematology Am Soc Hematol Educ Program. 2012;2012:389-96. doi: 10.1182/asheducation-2012.1.389. Hematology Am Soc Hematol Educ Program. 2012. PMID: 23233609 Review.
Cited by
-
Tyrosine kinome sequencing of pediatric acute lymphoblastic leukemia: a report from the Children's Oncology Group _target Project.Blood. 2013 Jan 17;121(3):485-8. doi: 10.1182/blood-2012-04-422691. Epub 2012 Dec 4. Blood. 2013. PMID: 23212523 Free PMC article.
-
Ikaros and tumor suppression in acute lymphoblastic leukemia.Crit Rev Oncog. 2011;16(1-2):3-12. doi: 10.1615/critrevoncog.v16.i1-2.20. Crit Rev Oncog. 2011. PMID: 22150303 Free PMC article. Review.
-
Improving access to novel agents for childhood leukemia.Cancer. 2015 Jun 15;121(12):1927-36. doi: 10.1002/cncr.29267. Epub 2015 Feb 11. Cancer. 2015. PMID: 25678105 Free PMC article. Review.
-
DUX Hunting-Clinical Features and Diagnostic Challenges Associated with DUX4-Rearranged Leukaemia.Cancers (Basel). 2020 Sep 30;12(10):2815. doi: 10.3390/cancers12102815. Cancers (Basel). 2020. PMID: 33007870 Free PMC article. Review.
-
Function of Ikaros as a tumor suppressor in B cell acute lymphoblastic leukemia.Am J Blood Res. 2013;3(1):1-13. Epub 2013 Jan 17. Am J Blood Res. 2013. PMID: 23358883 Free PMC article.
References
-
- Pui CH, Behm FG, Downing JR, et al. 11q23/MLL rearrangement confers a poor prognosis in infants with acute lymphoblastic leukemia. J Clin Oncol. 1994;12(5):909–915. - PubMed
-
- Uckun FM, Nachman JB, Sather HN, et al. Clinical significance of Philadelphia chromosome positive pediatric acute lymphoblastic leukemia in the context of contemporary intensive therapies: a report from the Children's Cancer Group. Cancer. 1998;83(9):2030–2039. - PubMed
-
- Shurtleff SA, Buijs A, Behm FG, et al. TEL/AML1 fusion resulting from a cryptic t(12;21) is the most common genetic lesion in pediatric ALL and defines a subgroup of patients with an excellent prognosis. Leukemia. 1995;9(12):1985–1989. - PubMed
-
- Pui CH, Robison LL, Look AT. Acute lymphoblastic leukaemia. Lancet. 2008;371(9617):1030–1043. - PubMed
-
- Pui CH, Evans WE. Drug therapy: treatment of acute lymphoblastic leukemia. N Engl J Med. 2006;354(2):166–178. - PubMed
Publication types
MeSH terms
Substances
Associated data
Grants and funding
LinkOut - more resources
Full Text Sources
Other Literature Sources
Medical
Molecular Biology Databases
Research Materials
Miscellaneous

