Regulation of mineralocorticoid receptor expression during neuronal differentiation of murine embryonic stem cells
- PMID: 20207834
- PMCID: PMC3107824
- DOI: 10.1210/en.2009-0753
Regulation of mineralocorticoid receptor expression during neuronal differentiation of murine embryonic stem cells
Abstract
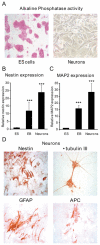
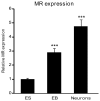
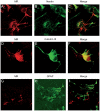
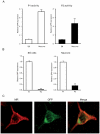
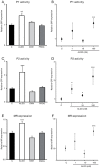
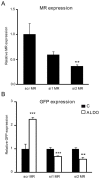
Mineralocorticoid receptor (MR) plays a critical role in brain function. However, the regulatory mechanisms controlling neuronal MR expression that constitutes a key element of the hormonal response are currently unknown. Two alternative P1 and P2 promoters drive human MR gene transcription. To examine promoter activities and their regulation during neuronal differentiation and in mature neurons, we generated stably transfected recombinant murine embryonic stem cell (ES) lines, namely P1-GFP and P2-GFP, in which each promoter drove the expression of the reporter gene green fluorescent protein (GFP). An optimized protocol, using embryoid bodies and retinoic acid, permitted us to obtain a reproducible neuronal differentiation as revealed by the decrease in phosphatase alkaline activity, the concomitant appearance of morphological changes (neurites), and the increase in the expression of neuronal markers (nestin, beta-tubulin III, and microtubule-associated protein-2) as demonstrated by immunocytochemistry and quantitative PCR. Using these cell-based models, we showed that MR expression increased by 5-fold during neuronal differentiation, MR being preferentially if not exclusively expressed in mature neurons. Although the P2 promoter was always weaker than the P1 promoter during neuronal differentiation, their activities increased by 7- and 5-fold, respectively, and correlated with MR expression. Finally, although progesterone and dexamethasone were ineffective, aldosterone stimulated both P1 and P2 activity and MR expression, an effect that was abrogated by knockdown of MR by small interfering RNA. In conclusion, we provide evidence for a tight transcriptional control of MR expression during neuronal differentiation. Given the neuroprotective and antiapoptotic role proposed for MR, the neuronal differentiation of ES cell lines opens potential therapeutic perspectives in neurological and psychiatric diseases.
Figures

Similar articles
-
Mineralocorticoid receptor overexpression facilitates differentiation and promotes survival of embryonic stem cell-derived neurons.Endocrinology. 2012 Mar;153(3):1330-40. doi: 10.1210/en.2011-1436. Epub 2012 Jan 10. Endocrinology. 2012. PMID: 22234470 Free PMC article.
-
Hoxa1 is required for the retinoic acid-induced differentiation of embryonic stem cells into neurons.J Neurosci Res. 2008 Oct;86(13):2809-19. doi: 10.1002/jnr.21729. J Neurosci Res. 2008. PMID: 18512762
-
Mineralocorticoid receptor overexpression in embryonic stem cell-derived cardiomyocytes increases their beating frequency.Cardiovasc Res. 2010 Aug 1;87(3):467-75. doi: 10.1093/cvr/cvq087. Epub 2010 Mar 17. Cardiovasc Res. 2010. PMID: 20299331
-
Expression and function of the human mineralocorticoid receptor: lessons from transgenic mouse models.Mol Cell Endocrinol. 2004 Mar 31;217(1-2):127-36. doi: 10.1016/j.mce.2003.10.045. Mol Cell Endocrinol. 2004. PMID: 15134811 Review.
-
Transgenic mouse models to study human mineralocorticoid receptor function in vivo.Kidney Int. 2000 Apr;57(4):1299-306. doi: 10.1046/j.1523-1755.2000.00966.x. Kidney Int. 2000. PMID: 10760058 Review.
Cited by
-
Enteric Microbiota⁻Gut⁻Brain Axis from the Perspective of Nuclear Receptors.Int J Mol Sci. 2018 Jul 28;19(8):2210. doi: 10.3390/ijms19082210. Int J Mol Sci. 2018. PMID: 30060580 Free PMC article. Review.
-
Mineralocorticoid Receptor May Regulate Glucose Homeostasis through the Induction of Interleukin-6 and Glucagon-Like peptide-1 in Pancreatic Islets.J Clin Med. 2019 May 14;8(5):674. doi: 10.3390/jcm8050674. J Clin Med. 2019. PMID: 31091693 Free PMC article.
-
GPR48 increases mineralocorticoid receptor gene expression.J Am Soc Nephrol. 2012 Feb;23(2):281-93. doi: 10.1681/ASN.2011040351. Epub 2011 Dec 1. J Am Soc Nephrol. 2012. PMID: 22135314 Free PMC article.
-
The protective side of the mineralocorticoid receptor.Endocrinology. 2012 Apr;153(4):1565-7. doi: 10.1210/en.2011-2184. Epub 2012 Mar 9. Endocrinology. 2012. PMID: 22408177 Free PMC article. No abstract available.
-
Expression of mineralocorticoid and glucocorticoid receptors in preautonomic neurons of the rat paraventricular nucleus.Am J Physiol Regul Integr Comp Physiol. 2014 Mar 1;306(5):R328-40. doi: 10.1152/ajpregu.00506.2013. Epub 2013 Dec 31. Am J Physiol Regul Integr Comp Physiol. 2014. PMID: 24381176 Free PMC article.
References
-
- Geerling JC, Loewy AD. Aldosterone-sensitive neurons in the nucleus of the solitary: efferent projections. J Comp Neurol. 2006;498:223–250. - PubMed
-
- De Kloet ER, Vreugdenhil E, Oitzl MS, Joels M. Brain corticosteroid receptor balance in health and disease. Endocr Rev. 1998;19:269–301. - PubMed
-
- Joels M. Functional actions of corticosteroids in the hippocampus. Eur J Pharmacol. 2008;583:312–321. - PubMed

