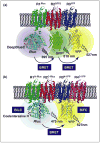
Lighting up multiprotein complexes: lessons from GPCR oligomerization
- PMID: 20542584
- PMCID: PMC3065825
- DOI: 10.1016/j.tibtech.2010.05.002
Lighting up multiprotein complexes: lessons from GPCR oligomerization
Abstract
Spatiotemporal characterization of protein-protein interactions (PPIs) is essential in determining the molecular mechanisms of intracellular signaling processes. In this review, we discuss how new methodological strategies derived from non-invasive fluorescence- and luminescence-based approaches (FRET, BRET, BiFC and BiLC), when applied to the study of G protein-coupled receptor (GPCR) oligomerization, can be used to detect specific PPIs in live cells. These technologies alone or in concert with complementary methods (SRET, BRET or BiFC, and SNAP-tag or TR-FRET) can be extremely powerful approaches for PPI visualization, even between more than two proteins. Here we provide a comprehensive update on all the biotechnological aspects, including the strengths and weaknesses, of new fluorescence- and luminescence-based methodologies, with a specific focus on their application for studying PPIs.
Copyright 2010 Elsevier Ltd. All rights reserved.
Figures


Similar articles
-
Oligomerization of G protein-coupled receptors: biochemical and biophysical methods.Curr Med Chem. 2011;18(30):4606-34. doi: 10.2174/092986711797379285. Curr Med Chem. 2011. PMID: 21864280 Review.
-
Fluorescence resonance energy transfer-based technologies in the study of protein-protein interactions at the cell surface.Methods. 2012 Aug;57(4):467-72. doi: 10.1016/j.ymeth.2012.05.007. Epub 2012 Jun 6. Methods. 2012. PMID: 22683304 Review.
-
Luminescence- and Fluorescence-Based Complementation Assays to Screen for GPCR Oligomerization: Current State of the Art.Int J Mol Sci. 2019 Jun 17;20(12):2958. doi: 10.3390/ijms20122958. Int J Mol Sci. 2019. PMID: 31213021 Free PMC article. Review.
-
Cell-surface protein-protein interaction analysis with time-resolved FRET and snap-tag technologies: application to G protein-coupled receptor oligomerization.Methods Mol Biol. 2011;756:201-14. doi: 10.1007/978-1-61779-160-4_10. Methods Mol Biol. 2011. PMID: 21870227
-
A rigorous experimental framework for detecting protein oligomerization using bioluminescence resonance energy transfer.Nat Methods. 2006 Dec;3(12):1001-6. doi: 10.1038/nmeth978. Epub 2006 Nov 5. Nat Methods. 2006. PMID: 17086179
Cited by
-
A novel approach to quantify G-protein-coupled receptor dimerization equilibrium using bioluminescence resonance energy transfer.Methods Mol Biol. 2013;1013:93-127. doi: 10.1007/978-1-62703-426-5_7. Methods Mol Biol. 2013. PMID: 23625495 Free PMC article.
-
Muscarinic receptor oligomerization.Neuropharmacology. 2018 Jul 1;136(Pt C):401-410. doi: 10.1016/j.neuropharm.2017.11.023. Epub 2017 Nov 14. Neuropharmacology. 2018. PMID: 29146505 Free PMC article. Review.
-
Design and development of stapled transmembrane peptides that disrupt the activity of G-protein-coupled receptor oligomers.J Biol Chem. 2019 Nov 8;294(45):16587-16603. doi: 10.1074/jbc.RA119.009160. Epub 2019 Aug 29. J Biol Chem. 2019. PMID: 31467080 Free PMC article.
-
Contributions of fluorescence techniques to understanding G protein-coupled receptor dimerisation.Biophys Rev. 2012 Dec;4(4):291-298. doi: 10.1007/s12551-012-0073-z. Epub 2012 Apr 12. Biophys Rev. 2012. PMID: 28510206 Free PMC article. Review.
-
Angiotensin and Endothelin Receptor Structures With Implications for Signaling Regulation and Pharmacological _targeting.Front Endocrinol (Lausanne). 2022 Apr 19;13:880002. doi: 10.3389/fendo.2022.880002. eCollection 2022. Front Endocrinol (Lausanne). 2022. PMID: 35518926 Free PMC article. Review.
References
-
- Miller J, Stagljar I. Using the yeast two-hybrid system to identify interacting proteins. Methods Mol Biol. 2004;261:247–262. - PubMed
-
- Suter B, et al. Two-hybrid technologies in proteomics research. Curr Opin Biotechnol. 2008;19:316–323. - PubMed
-
- Selbach M, Mann M. Protein interaction screening by quantitative immunoprecipitation combined with knockdown (QUICK) Nat Methods. 2006;3:981–983. - PubMed
-
- Ciruela F. Fluorescence-based methods in the study of protein–protein interactions in living cells. Curr Opin Biotechnol. 2008;19:338–343. - PubMed
-
- Gandia J, et al. Light resonance energy transfer-based methods in the study of G protein-coupled receptor oligomerization. Bioessays. 2008;30:82–89. - PubMed

