Virus-plus-susceptibility gene interaction determines Crohn's disease gene Atg16L1 phenotypes in intestine
- PMID: 20602997
- PMCID: PMC2908380
- DOI: 10.1016/j.cell.2010.05.009
Virus-plus-susceptibility gene interaction determines Crohn's disease gene Atg16L1 phenotypes in intestine
Abstract
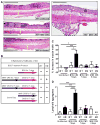
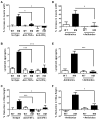
It is unclear why disease occurs in only a small proportion of persons carrying common risk alleles of disease susceptibility genes. Here we demonstrate that an interaction between a specific virus infection and a mutation in the Crohn's disease susceptibility gene Atg16L1 induces intestinal pathologies in mice. This virus-plus-susceptibility gene interaction generated abnormalities in granule packaging and unique patterns of gene expression in Paneth cells. Further, the response to injury induced by the toxic substance dextran sodium sulfate was fundamentally altered to include pathologies resembling aspects of Crohn's disease. These pathologies triggered by virus-plus-susceptibility gene interaction were dependent on TNFalpha and IFNgamma and were prevented by treatment with broad spectrum antibiotics. Thus, we provide a specific example of how a virus-plus-susceptibility gene interaction can, in combination with additional environmental factors and commensal bacteria, determine the phenotype of hosts carrying common risk alleles for inflammatory disease.
Figures


Comment in
-
D'oh! genes and environment cause Crohn's disease.Cell. 2010 Jun 25;141(7):1114-6. doi: 10.1016/j.cell.2010.06.015. Cell. 2010. PMID: 20602995 Free PMC article.
-
Mucosal immunology: Germ and gene tag team.Nat Rev Immunol. 2010 Aug;10(8):542. doi: 10.1038/nri2823. Nat Rev Immunol. 2010. PMID: 20672478 No abstract available.
-
Environmental triggers, genetic background, and Crohn's disease.Gastroenterology. 2011 Jan;140(1):363-5. doi: 10.1053/j.gastro.2010.11.015. Epub 2010 Nov 19. Gastroenterology. 2011. PMID: 21094202 No abstract available.
Similar articles
-
A key role for autophagy and the autophagy gene Atg16l1 in mouse and human intestinal Paneth cells.Nature. 2008 Nov 13;456(7219):259-63. doi: 10.1038/nature07416. Epub 2008 Oct 5. Nature. 2008. PMID: 18849966 Free PMC article.
-
Genomic ATG16L1 risk allele-restricted Paneth cell ER stress in quiescent Crohn's disease.Gut. 2014 Jul;63(7):1081-91. doi: 10.1136/gutjnl-2012-303527. Epub 2013 Aug 20. Gut. 2014. PMID: 23964099
-
Interaction between smoking and ATG16L1T300A triggers Paneth cell defects in Crohn's disease.J Clin Invest. 2018 Nov 1;128(11):5110-5122. doi: 10.1172/JCI120453. Epub 2018 Oct 15. J Clin Invest. 2018. PMID: 30137026 Free PMC article.
-
Decoding norovirus infection in Crohn's disease.Inflamm Bowel Dis. 2014 Apr;20(4):767-70. doi: 10.1097/01.MIB.0000440613.83703.4a. Inflamm Bowel Dis. 2014. PMID: 24351661 Review.
-
Viruses, autophagy genes, and Crohn's disease.Viruses. 2011 Jul;3(7):1281-311. doi: 10.3390/v3071281. Epub 2011 Jul 21. Viruses. 2011. PMID: 21994779 Free PMC article. Review.
Cited by
-
Pathogenesis of Crohn's disease.F1000Prime Rep. 2015 Apr 2;7:44. doi: 10.12703/P7-44. eCollection 2015. F1000Prime Rep. 2015. PMID: 26097717 Free PMC article. Review.
-
From genetics of inflammatory bowel disease towards mechanistic insights.Trends Immunol. 2013 Aug;34(8):371-8. doi: 10.1016/j.it.2013.04.001. Epub 2013 Apr 30. Trends Immunol. 2013. PMID: 23639549 Free PMC article. Review.
-
Helminth infection impairs autophagy-mediated killing of bacterial enteropathogens by macrophages.J Immunol. 2012 Aug 1;189(3):1459-66. doi: 10.4049/jimmunol.1200484. Epub 2012 Jun 25. J Immunol. 2012. PMID: 22732589 Free PMC article.
-
Autophagy suppresses interleukin-1β (IL-1β) signaling by activation of p62 degradation via lysosomal and proteasomal pathways.J Biol Chem. 2012 Feb 3;287(6):4033-40. doi: 10.1074/jbc.M111.280065. Epub 2011 Dec 13. J Biol Chem. 2012. PMID: 22167182 Free PMC article.
-
Of LAP, CUPS, and DRibbles - Unconventional Use of Autophagy Proteins for MHC Restricted Antigen Presentation.Front Immunol. 2015 Apr 29;6:200. doi: 10.3389/fimmu.2015.00200. eCollection 2015. Front Immunol. 2015. PMID: 25972871 Free PMC article. Review.
References
-
- Agus SG, Dolin R, Wyatt RG, Tousimis AJ, Northrup RS. Acute infectious nonbacterial gastroenteritis: intestinal histopathology. Histologic and enzymatic alterations during illness produced by the Norwalk agent in man. Ann Intern Med. 1973;79:18–25. - PubMed
-
- Barnes MJ, Powrie F. Regulatory T cells reinforce intestinal homeostasis. Immunity. 2009;31:401–411. - PubMed
Publication types
MeSH terms
Substances
Grants and funding
- U54 AI057160-06S1/AI/NIAID NIH HHS/United States
- U54 AI057160-065903/AI/NIAID NIH HHS/United States
- P30 DK052574-050001/DK/NIDDK NIH HHS/United States
- P30 DK052574-020001/DK/NIDDK NIH HHS/United States
- P30 DK052574-089005/DK/NIDDK NIH HHS/United States
- U54 AI057160-075888/AI/NIAID NIH HHS/United States
- T32 AI007172/AI/NIAID NIH HHS/United States
- R01 AI084887-01/AI/NIAID NIH HHS/United States
- P30 DK052574-04/DK/NIDDK NIH HHS/United States
- P30 DK043351-19S2/DK/NIDDK NIH HHS/United States
- R01 AI084887/AI/NIAID NIH HHS/United States
- T32 AI007172-27/AI/NIAID NIH HHS/United States
- P30 DK052574-01A1/DK/NIDDK NIH HHS/United States
- DK043351/DK/NIDDK NIH HHS/United States
- RC1 DK086502/DK/NIDDK NIH HHS/United States
- P30 DK052574-10S29005/DK/NIDDK NIH HHS/United States
- P30 DK040561/DK/NIDDK NIH HHS/United States
- T32 AI007172-30/AI/NIAID NIH HHS/United States
- P30 DK052574-069005/DK/NIDDK NIH HHS/United States
- P30 DK043351/DK/NIDDK NIH HHS/United States
- U54 AI057160-07/AI/NIAID NIH HHS/United States
- P30 DK052574-099005/DK/NIDDK NIH HHS/United States
- T32 AI007172-28/AI/NIAID NIH HHS/United States
- RC1 DK086502-01/DK/NIDDK NIH HHS/United States
- P30 DK052574-109005/DK/NIDDK NIH HHS/United States
- P30 DK052574-06/DK/NIDDK NIH HHS/United States
- P30 DK040561-15/DK/NIDDK NIH HHS/United States
- P30 DK052574-05/DK/NIDDK NIH HHS/United States
- U54 AI057160-075903/AI/NIAID NIH HHS/United States
- P30 DK052574-09/DK/NIDDK NIH HHS/United States
- T32 AI007172-29/AI/NIAID NIH HHS/United States
- R01 AI084887-02/AI/NIAID NIH HHS/United States
- U54 AI057160-065888/AI/NIAID NIH HHS/United States
- R01 DK083756-03/DK/NIDDK NIH HHS/United States
- DK52574/DK/NIDDK NIH HHS/United States
- P30 DK052574-07/DK/NIDDK NIH HHS/United States
- T32 AI007172-26/AI/NIAID NIH HHS/United States
- DK83756/DK/NIDDK NIH HHS/United States
- P30 DK052574-040001/DK/NIDDK NIH HHS/United States
- P30 DK052574-02/DK/NIDDK NIH HHS/United States
- NIH T32-AI007172/AI/NIAID NIH HHS/United States
- P30 DK052574-030001/DK/NIDDK NIH HHS/United States
- R01 DK083756-02/DK/NIDDK NIH HHS/United States
- P30 DK043351-18/DK/NIDDK NIH HHS/United States
- U54 AI057160-08/AI/NIAID NIH HHS/United States
- R01 DK083756-01/DK/NIDDK NIH HHS/United States
- P30 DK052574-10S19005/DK/NIDDK NIH HHS/United States
- T32 AI007172-25/AI/NIAID NIH HHS/United States
- U54 AI057160/AI/NIAID NIH HHS/United States
- P30 DK052574-08/DK/NIDDK NIH HHS/United States
- U54 AI057160-075890/AI/NIAID NIH HHS/United States
- U54 AI057160-075878/AI/NIAID NIH HHS/United States
- P30 DK052574-01A10001/DK/NIDDK NIH HHS/United States
- U54 AI057160-065890/AI/NIAID NIH HHS/United States
- DK086502/DK/NIDDK NIH HHS/United States
- P30 DK052574/DK/NIDDK NIH HHS/United States
- U54 AI057160-065878/AI/NIAID NIH HHS/United States
- P30 DK052574-03/DK/NIDDK NIH HHS/United States
- P30 DK043351-19S1/DK/NIDDK NIH HHS/United States
- R01 DK083756/DK/NIDDK NIH HHS/United States
- U54 AI057160-06/AI/NIAID NIH HHS/United States
- P30 DK043351-19/DK/NIDDK NIH HHS/United States
- U54 AI057160-06S18818/AI/NIAID NIH HHS/United States
- P30 DK052574-079005/DK/NIDDK NIH HHS/United States
- T32 AI007172-31/AI/NIAID NIH HHS/United States
LinkOut - more resources
Full Text Sources
Other Literature Sources
Medical
Molecular Biology Databases

