Reduced fertility in vitro in mice lacking the cystatin CRES (cystatin-related epididymal spermatogenic): rescue by exposure of spermatozoa to dibutyryl cAMP and isobutylmethylxanthine
- PMID: 20811015
- PMCID: PMC3012566
- DOI: 10.1095/biolreprod.110.084855
Reduced fertility in vitro in mice lacking the cystatin CRES (cystatin-related epididymal spermatogenic): rescue by exposure of spermatozoa to dibutyryl cAMP and isobutylmethylxanthine
Abstract
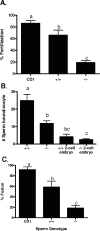
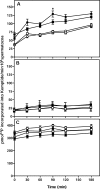
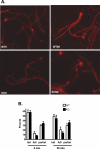
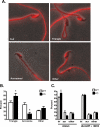
The cystatin CRES (cystatin-related epididymal spermatogenic; Cst8) is the defining member of a reproductive subgroup of family 2 cystatins of cysteine protease inhibitors and is present in the epididymis and spermatozoa, suggesting roles in sperm maturation and fertilization. To elucidate the role of CRES in reproduction, mice lacking the Cst8 gene were generated and their fertility examined. Although both male and female Cst8(-/-) mice generated offspring in vivo, spermatozoa from Cst8(-/-) mice exhibited a profound fertility defect in vitro. Compared to spermatozoa from Cst8(+/+) mice, spermatozoa from Cst8(-/-) mice were unable to undergo a progesterone-stimulated acrosome reaction and had decreased levels of protein tyrosine phosphorylation, suggesting a defect in the ability of Cst8(-/-) spermatozoa to capacitate. Incubation of Cst8(-/-) spermatozoa with dibutyryl cAMP and 3-isobutyl-1-methylxanthine rescued the fertility defect, including the capacity for sperm protein tyrosine phosphorylation. Both untreated Cst8(+/+) and Cst8(-/-) spermatozoa, however, exhibited similar increased total levels of cAMP and protein kinase A (PKA) activity throughout the capacitation time course compared to spermatozoa incubated under noncapacitating conditions. Taken together, these results suggest that mice lacking CRES may have altered local levels of cAMP/PKA activity, perhaps because of improper partitioning or tethering of these signaling molecules, or that the CRES defect does not directly involve cAMP/PKA but other signaling pathways that regulate protein tyrosine phosphorylation and capacitation.
Figures



Similar articles
-
Cystatin-related epididymal spermatogenic subgroup members are part of an amyloid matrix and associated with extracellular vesicles in the mouse epididymal lumen.Mol Hum Reprod. 2016 Nov;22(11):729-744. doi: 10.1093/molehr/gaw049. Epub 2016 Jul 21. Mol Hum Reprod. 2016. PMID: 27445316 Free PMC article.
-
Alterations in the testis and epididymis associated with loss of function of the cystatin-related epididymal spermatogenic (CRES) protein.J Androl. 2011 Jul-Aug;32(4):444-63. doi: 10.2164/jandrol.110.010694. Epub 2010 Nov 4. J Androl. 2011. PMID: 21051588 Free PMC article.
-
Immunolocalization of CRES (Cystatin-related epididymal spermatogenic) protein in the acrosomes of mouse spermatozoa.Biol Reprod. 1999 Jun;60(6):1542-52. doi: 10.1095/biolreprod60.6.1542. Biol Reprod. 1999. PMID: 10330117
-
Cystatin-related epididymal spermatogenic aggregates in the epididymis.J Androl. 2011 Nov-Dec;32(6):679-85. doi: 10.2164/jandrol.111.012963. Epub 2011 Jul 15. J Androl. 2011. PMID: 21764901 Free PMC article. Review.
-
[Cres (cystatin-related epididymal spermatogenic) gene regulation and function].Zhonghua Nan Ke Xue. 2002;8(5):313-8. Zhonghua Nan Ke Xue. 2002. PMID: 12479114 Review. Chinese.
Cited by
-
Male infertility-related molecules involved in sperm-oocyte fusion.J Reprod Dev. 2017 Feb 16;63(1):1-7. doi: 10.1262/jrd.2016-108. Epub 2016 Dec 1. J Reprod Dev. 2017. PMID: 27904014 Free PMC article. Review.
-
Impact of glycosylation on the unimpaired functions of the sperm.Clin Exp Reprod Med. 2015 Sep;42(3):77-85. doi: 10.5653/cerm.2015.42.3.77. Epub 2015 Sep 30. Clin Exp Reprod Med. 2015. PMID: 26473106 Free PMC article. Review.
-
Functional Amyloids in Reproduction.Biomolecules. 2017 Jun 29;7(3):46. doi: 10.3390/biom7030046. Biomolecules. 2017. PMID: 28661450 Free PMC article. Review.
-
Cystatin-related epididymal spermatogenic subgroup members are part of an amyloid matrix and associated with extracellular vesicles in the mouse epididymal lumen.Mol Hum Reprod. 2016 Nov;22(11):729-744. doi: 10.1093/molehr/gaw049. Epub 2016 Jul 21. Mol Hum Reprod. 2016. PMID: 27445316 Free PMC article.
-
Albumin is synthesized in epididymis and aggregates in a high molecular mass glycoprotein complex involved in sperm-egg fertilization.PLoS One. 2014 Aug 1;9(8):e103566. doi: 10.1371/journal.pone.0103566. eCollection 2014. PLoS One. 2014. PMID: 25084016 Free PMC article.
References
-
- Cornwall GA, Orgebin-Crist M-C, Hann SR. The CRES gene: a unique testis-regulated gene related to the cystatin family is highly restricted in its expression to the proximal region of the mouse epididymis. Mol Endocrinol 1992; 6: 1653 1664 - PubMed
-
- Cornwall GA, Hsia N. A new subgroup of the family 2 cystatins. Mol Cell Endocrinol 2003; 200: 1 8 - PubMed
-
- Cornwall GA, Hann SR. Transient appearance of the CRES protein during spermatogenesis and caput epididymal sperm maturation. Mol Reprod Dev 1995; 41: 37 46 - PubMed
-
- Cornwall GA, Cameron A, Lindberg I, Hardy D, Cormier N, Hsia N. CRES protein inhibits the serine protease prohormone convertase PC2. Endocrinology 2003; 144: 901 908 - PubMed
-
- Wang PH, Do YS, Macaulay L, Shinagawa T, Anderson PW, Baxter JD, Hsueh WA. Identification of renal cathepsin B as a human prorenin-processing enzyme. J Biol Chem 1991; 266: 12633 12638 - PubMed
Publication types
MeSH terms
Substances
Grants and funding
LinkOut - more resources
Full Text Sources
Other Literature Sources
Molecular Biology Databases

