Structural basis of E2-25K/UBB+1 interaction leading to proteasome inhibition and neurotoxicity
- PMID: 20826778
- PMCID: PMC2975229
- DOI: 10.1074/jbc.M110.145219
Structural basis of E2-25K/UBB+1 interaction leading to proteasome inhibition and neurotoxicity
Abstract
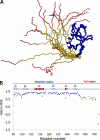
E2-25K/Hip2 is an unusual ubiquitin-conjugating enzyme that interacts with the frameshift mutant of ubiquitin B (UBB(+1)) and has been identified as a crucial factor regulating amyloid-β neurotoxicity. To study the structural basis of the neurotoxicity mediated by the E2-25K-UBB(+1) interaction, we determined the three-dimensional structures of UBB(+1), E2-25K and the E2-25K/ubiquitin, and E2-25K/UBB(+1) complex. The structures revealed that ubiquitin or UBB(+1) is bound to E2-25K via the enzyme MGF motif and residues in α9 of the enzyme. Polyubiquitylation assays together with analyses of various E2-25K mutants showed that disrupting UBB(+1) binding markedly diminishes synthesis of neurotoxic UBB(+1)-anchored polyubiquitin. These results suggest that the interaction between E2-25K and UBB(+1) is critical for the synthesis and accumulation of UBB(+1)-anchored polyubiquitin, which results in proteasomal inhibition and neuronal cell death.
Figures


Similar articles
-
The E2-25K ubiquitin-associated (UBA) domain aids in polyubiquitin chain synthesis and linkage specificity.Biochem Biophys Res Commun. 2011 Feb 25;405(4):662-6. doi: 10.1016/j.bbrc.2011.01.089. Epub 2011 Jan 31. Biochem Biophys Res Commun. 2011. PMID: 21281599 Free PMC article.
-
Essential role of E2-25K/Hip-2 in mediating amyloid-beta neurotoxicity.Mol Cell. 2003 Sep;12(3):553-63. doi: 10.1016/j.molcel.2003.08.005. Mol Cell. 2003. PMID: 14527403
-
Structure and function of ubiquitin conjugating enzyme E2-25K: the tail is a core-dependent activity element.Biochemistry. 1997 Aug 26;36(34):10526-37. doi: 10.1021/bi970750u. Biochemistry. 1997. PMID: 9265633
-
Alzheimer's disease meets the ubiquitin-proteasome system.Trends Mol Med. 2004 Nov;10(11):565-70. doi: 10.1016/j.molmed.2004.09.005. Trends Mol Med. 2004. PMID: 15519283 Review.
-
Review: unchained maladie - a reassessment of the role of Ubb(+1) -capped polyubiquitin chains in Alzheimer's disease.Neuropathol Appl Neurobiol. 2012 Apr;38(2):118-31. doi: 10.1111/j.1365-2990.2011.01236.x. Neuropathol Appl Neurobiol. 2012. PMID: 22082077 Review.
Cited by
-
The E2-25K ubiquitin-associated (UBA) domain aids in polyubiquitin chain synthesis and linkage specificity.Biochem Biophys Res Commun. 2011 Feb 25;405(4):662-6. doi: 10.1016/j.bbrc.2011.01.089. Epub 2011 Jan 31. Biochem Biophys Res Commun. 2011. PMID: 21281599 Free PMC article.
-
Misframed ubiquitin and impaired protein quality control: an early event in Alzheimer's disease.Front Mol Neurosci. 2015 Sep 2;8:47. doi: 10.3389/fnmol.2015.00047. eCollection 2015. Front Mol Neurosci. 2015. PMID: 26388726 Free PMC article. Review.
-
Fusion crystallization reveals the behavior of both the 1TEL crystallization chaperone and the TNK1 UBA domain.Structure. 2023 Dec 7;31(12):1589-1603.e6. doi: 10.1016/j.str.2023.09.001. Epub 2023 Sep 29. Structure. 2023. PMID: 37776857 Free PMC article.
-
What Are the Reliable Plasma Biomarkers for Mild Cognitive Impairment? A Clinical 4D Proteomics Study and Validation.Mediators Inflamm. 2024 May 27;2024:7709277. doi: 10.1155/2024/7709277. eCollection 2024. Mediators Inflamm. 2024. PMID: 38883967 Free PMC article.
-
E2-25K SUMOylation inhibits proteasome for cell death during cerebral ischemia/reperfusion.Cell Death Dis. 2016 Dec 29;7(12):e2573. doi: 10.1038/cddis.2016.428. Cell Death Dis. 2016. PMID: 28032866 Free PMC article.
References
-
- Lee V. M., Goedert M., Trojanowski J. Q. (2001) Annu. Rev. Neurosci. 24, 1121–1159 - PubMed
-
- de Pril R., Fischer D. F., Roos R. A., van Leeuwen F. W. (2007) Mol. Cell. Neurosci. 34, 10–19 - PubMed
-
- van Leeuwen F. W., de Kleijn D. P., van den Hurk H. H., Neubauer A., Sonnemans M. A., Sluijs J. A., Köycü S., Ramdjielal R. D., Salehi A., Martens G. J., Grosveld F. G., Peter J., Burbach H., Hol E. M. (1998) Science 279, 242–247 - PubMed
-
- Hilbich C., Mönning U., Grund C., Masters C. L., Beyreuther K. (1993) J. Biol. Chem. 268, 26571–26577 - PubMed
-
- van Leeuwen F. W., Hol E. M., Fischer D. F. (2006) J. Alzheimers Dis. 9, 319–325 - PubMed
Publication types
MeSH terms
Substances
Associated data
- Actions
- Actions
- Actions
LinkOut - more resources
Full Text Sources

