. 2010 Oct 7:9:267.
doi: 10.1186/1476-4598-9-267.

Epigenetic regulation of CpG promoter methylation in invasive prostate cancer cells

Affiliations

Epigenetic regulation of CpG promoter methylation in invasive prostate cancer cells

Lesley A Mathews et al. Mol Cancer. .

Abstract

Background: Recently, much attention has been focused on gaining a better understanding of the different populations of cells within a tumor and their contribution to cancer progression. One of the most commonly used methods to isolate a more aggressive sub-population of cells utilizes cell sorting based on expression of certain cell adhesion molecules. A recently established method we developed is to isolate these more aggressive cells based on their properties of increased invasive ability. These more invasive cells have been previously characterized as tumor initiating cells (TICs) that have a stem-like genomic signature and express a number of stem cell genes including Oct3/4 and Nanog and are more tumorigenic compared to their 'non-invasive' counterpart. They also have a profile reminiscent of cells undergoing a classic pattern of epithelial to mesenchymal transition or EMT. Using this model of invasion, we sought to investigate which genes are under epigenetic control in this rare population of cells. Epigenetic modifications, specifically DNA methylation, are key events regulating the process of normal human development. To determine the specific methylation pattern in these invasive prostate cells, and if any developmental genes were being differentially regulated, we analyzed differences in global CpG promoter methylation.

Results: Differentially methylated genes were determined and select genes were chosen for additional analyses. The non-receptor tyrosine kinase BMX and transcription factor SOX1 were found to play a significant role in invasion. Ingenuity pathway analysis revealed the methylated gene list frequently displayed genes from the IL-6/STAT3 pathway. Cells which have decreased levels of the _targets BMX and SOX1 also display loss of STAT3 activity. Finally, using Oncomine, it was determined that more aggressive metastatic prostate cancers in humans also have higher levels of both Stat3 and Sox1.

Conclusions: Using this method we can begin to understand which genes are epigenetically regulated in the invasive population compared to the bulk tumor cells. These aggressive sub-populations of cells may be linked to the cancer stem cell hypothesis, making their patterns of epigenetic regulation very attractive for biomarker analysis.


Figures

Figure 1
Figure 1
Isolation and MeDIP analysis of invasive prostate cancer cells. Matrigel-coated 24-well inserts (8 μM pore size) and non-coated control inserts purchased from BD Biosciences were used according to manufacturer's instructions. A range of 70,000-100,000 cells was seeded for the invasion. Cells were seeded in serum-free RPMI and migrated toward media specific for stem cells (termed SCM). For the isolation of DNA from top "non-invading" and bottom "invading" cells, parallel invasion chambers were set up. For non-invading cells, the bottom of the membrane was scrubbed with a cotton swab, and cells on top were harvested using 500 μL of trypsin incubated at 37°C for 5 minutes. To obtain the invading cells, the top of the membrane was scrubbed with a cotton swab, and the membranes were placed at -80°C until DNA extraction was performed or the cells were harvested with trypsin, as previously mentioned. DNA was extracted using a DNeasy kit (Qiagen), where the cell-based protocol was used to isolate DNA for the top cells, while the tissue extraction method was used to isolate the invaded cells from the previously stored membrane. Total genomic DNA was digested with MseI overnight, and methylated DNA was then collected using MethylCollector kit (Active Motif). Input and methylated DNA was then amplified with 2 rounds of PCR and labeled with either Cy5 for methylated or Cy3 for total DNA. The samples were combined and applied to Agilent's Human Promoter Tiling Array for 40 hours at 65°C. The arrays were then scanned with an Axon scanner (4000B) using GenePixPro version 6.1. The data were extracted using Agilent's Feature Extraction software 9.3.5.1, and differences in promoter methylation of genes in non-invasive and invasive cells were compared using Agilent's ChIP Analytics software version 4.0. Selected _targets were then verified for methylation status using methylation-specific PCR, qRT-PCR and ICC.
Figure 2
Figure 2
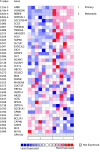
Oncomine analysis of overlapping _targets methylated in both LNCaP and DU145 cells. Isolated _targets from the methylation arrays overlapping in LNCaP and DU145 cells were analyzed in Oncomine 4.2 (Ann Arbor, MI). The heat map represents raw data from the Varambally over-expression in prostate cancer analysis comparing primary tissue and metastatic tissue [17]. Expression is in terms of normalized over-expression units. The P-value represents a student's t-test comparing primary and metastatic expression and the gene ID is provided. Genes of interest included Sox1 (p = 0.024) since it has high homology to the stem cell gene Sox2 and albeit demonstrating significance, Bmx (p = 0.294), since it has previously been implicated in prostate cancer regulation.
Figure 3
Figure 3
Validation of methylated _targets in LNcaP and DU145 cells. A) DNA was extracted using the DNeasy kit and total of 1 μg from parental (total) LNCaP and DU145 cells was bisulfite modified using the EpiTect Bisulfite kit from Qiagen. MS-PCR was performed using Platinum Taq Polymerase (Invitrogen) and 200 ng of either genomic of bisulfite treated DNA was used. The samples were visualized using a 1% agarose gel and ethidium bromide. Both Sox1 and Bmx are methylated in the LNCaP and DU145 cell lines. B) Total RNA was isolated using TRIzol and qRT-PCR analysis was performed using a StepOne Real-time PCR machine with TaqMan Gene Expression Assay reagents and probes. Isolation of DNA and cDNA from non-invasive and invasive cells was carried out as previously described in materials and methods. Relative fold induction of mRNA was compared between non-invasive and invasive cells using the Delta-Delta CT method of quantitation where the parental lines were set at 1.0 as the control, and 18S rRNA was used as a loading control. Increased levels of both Sox1 and Bmx are seen in invasive LNCaP and DU145 cells compared to the non-invasive and parental lines. Normal human prostate RNA was used as a control. A Two-way ANOVA with a Bonferroni post-test was performed to compare groups and * represents a p-value of < 0.05 comparing parental to non-invasive cells and ** comparing parental to invasive cells. C) Staining of invasive or non-invasive cells was performed directly on the Matrigel membrane. Cells were incubated with either anti-pBMX antibody or SOX1 overnight and goat anti-rabbit Alexa-488 was added for 1 hour. Membranes were mounted on glass slides with Vectashield containing DAPI and visualized with a Zeiss-510 L5 confocal microscope. Images were analyzed using the Zeiss LSM5 Image Browser (20×) and further prepared in Adobe Photoshop CS. Increased levels of pBMX and SOX1 are seen in invasive cells compared to the non-invasive cells on top of the membrane.
Figure 4
Figure 4
Functional Role of SOX1 during invasion. A) The Trans-Lentiviral pTRIPZ system from Open Biosystems was used to introduce shRNA against BMX, SOX1 or a non-silencing control vector in DU145 cells. The cells were selected for 2 weeks in 1 μg/mL of puromycin and single cell clones were generated. To induce expression of the shRNA 1 μg/mL of doxycycline was added. The plasmid is designed to have a TET inducible TurboRFP upstream of the shRNA and they should appear red upon successful infection. B) Lowered expression was confirmed using Western blotting. Follow up experiments were conducted using BMX clone 3 and 5 and SOX1 clone 7 and 8 since they demonstrated the most significant decrease in protein expression. Fold changes represent samples normalized to actin and the control level of expression. C) Proliferation assays were conduced using Cell Titer-Glo kit and assayed on Day 1, 3, 5 and 7. More proliferation is indicated by an increase in relative luciferase units (RLUs). *denotes statistical significant p < 0.05 compared to vector transfected cells. A significant decrease was observed in shSOX1 #7 cells compared to vector transfected cells, and a significant increase was observed in shBMX #5 cell line. D) Matrigel invasion assays were conducted for 24 hours toward SCM. Top cells were removed and bottom cells were stained with the Diff-Quick staining kit from Dade Behring. Cells were counted using 4 independent fields per sample and 2 chambers were used per cell line. *denotes statistical significance p < 0.05 compared to vector transfected cells. Both shSOX #7 and #8 demonstrated significant decreases in invasion toward SCM compared to vector transfected cells.
Figure 5
Figure 5
Direct interaction between SOX1 and STAT3. A) Matrigel invasion assays were performed for 24 hours toward SCM using DU145 cells in the presence of the anti-IL-6, the PI3K inhibitor LY294002, a small molecular inhibitor of MEK called U0126 (thus downstream inhibition of extracellular-related kinase (ERK1 and ERK2) mediated responses), a small molecule inhibitor JAK called AG490 (Janus Kinase) and an inhibitor of its partner signal transducers and activators of transcription-3 (STAT3) called Static or the Tec kinase family inhibitor LFM-A13.Significant differences were observed between control cells and those cells treated with U0126, Stattic, LY294002 and LFM-A13. B) qRT-PCR analysis was performed as mentioned in Figure 3. *denotes statistical significant p < 0.05 compared to the non-invasive cells. Increased levels of Stat3 are seen invasive LNCaP and DU145 cells compared to the parental lines. C) Staining of pSTAT3 in invasive or non-invasive DU145 cells was performed directly on the Matrigel membrane and carried out as previously described in Figure 3. D) DU145 lysates were incubated with either SOX1, STAT3 or BMX overnight at 4°C with rotation. Samples were then incubated with Protein A-agarose beads to isolate complexes. Membranes were then incubated overnight at 4°C using primary antibodies for STAT3 or SOX1. The membrane was developed using the Odyssey from Licor. Protein loading was normalized using actin as a control. E) Western blotting for STAT3 and pSTAT3 in sub-cellular protein extracts from DU145, NS, shBMX#3 or shSOX1#8. F) STAT3 EMSA: Each lane contains WT-IR STAT3 oligos. Lane 1-3 DU145, 4 and 5 NS, 6 and 7 shBMX#3, 8 and 9 shSOX1 #8 and 10 contains no protein. Lane 2 contains excess MU-IR STAT3 and lanes 3, 5, 7 and 9 contain excess unlabeled WT probe. Supershifited samples appear below and only contain WT-IR STAT3.
Figure 6
Figure 6
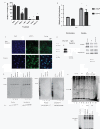
Inhibitor studies further determine that the IL-6/STAT3 pathway is involved in invasion. A) qRT-PCR demonstrating decreased expression of Stat3 in DU145 shSOX1 clone #7 cells and Mcl-1, a Stat3 _target gene. No change was observed in Myc or Survivin. *denotes statistical significant p < 0.05 compared to the vector transfected line. B) Prostatospheres were generated by culturing LNCaP cells in SCM+KO for 7 days and qRT-PCR analysis was performed. Compared to adherent LNCaP cells, expression of Bmx, Sox1 Mcl-1, Myc, Survivin, and Stat3 was significantly increased in the stem-like prostatospheres. *denotes statistical significant p < 0.001 compared to the adherent cells. C) Correlation of Sox1 and Stat3 was analyzed in Oncomine 4.2 (Ann Arbor, MI). The heat map represents raw data from the Varambally over-expression in prostate cancer analysis comparing primary tissue and metastatic tissue. Expression is in terms of normalized over-expression units. The P-value represents a student's t-test comparing primary and metastatic expression. D) Using the GEO database, expression of Sox1 and Bmx were compared between benign, primary or metastatic prostate tissue and significant differences were observed in Sox1. For Stat3, a comparison between Prostate Intraepithelial Neoplasia (PIN) and invasive prostate tumor tissue yield a significant difference in expression. *denotes statistical significant p < 0.05 compared to either benign samples or PIN.

Similar articles

Cited by

References

    1. Al-Hajj M, Wicha MS, Benito-Hernandez A, Morrison SJ, Clarke MF. Prospective identification of tumorigenic breast cancer cells. Proc Natl Acad Sci USA. 2003;100:3983–3988. doi: 10.1073/pnas.0530291100. - DOI - PMC - PubMed
    1. Graziano A, d'Aquino R, Tirino V, Desiderio V, Rossi A, Pirozzi G. The stem cell hypothesis in head and neck cancer. J Cell Biochem. 2008;103:408–412. doi: 10.1002/jcb.21436. - DOI - PubMed
    1. Cariati M, Purushotham AD. Stem cells and breast cancer. Histopathology. 2008;52:99–107. doi: 10.1111/j.1365-2559.2007.02895.x. - DOI - PubMed
    1. Kasper S. Exploring the Origins of the Normal Prostate and Prostate Cancer Stem Cell. Stem Cell Rev. 2008;4:193–201. doi: 10.1007/s12015-008-9033-1. - DOI - PMC - PubMed
    1. Takaishi S, Okumura T, Wang TC. Gastric cancer stem cells. J Clin Oncol. 2008;26:2876–2882. doi: 10.1200/JCO.2007.15.2603. - DOI - PMC - PubMed

Publication types

MeSH terms

Substances

  NODES
Note 6
Project 1
twitter 2