Oncogenic KRAS modulates mitochondrial metabolism in human colon cancer cells by inducing HIF-1α and HIF-2α _target genes
- PMID: 21073737
- PMCID: PMC2999617
- DOI: 10.1186/1476-4598-9-293
Oncogenic KRAS modulates mitochondrial metabolism in human colon cancer cells by inducing HIF-1α and HIF-2α _target genes
Abstract
Background: Activating KRAS mutations are important for cancer initiation and progression; and have recently been shown to cause primary resistance to therapies _targeting the epidermal growth factor receptor. Therefore, strategies are currently in development to overcome treatment resistance due to oncogenic KRAS. The hypoxia-inducible factors-1α and -2α (HIF-1α and HIF-2α) are activated in cancer due to dysregulated ras signaling.
Methods: To understand the individual and combined roles of HIF-1α and HIF-2α in cancer metabolism and oncogenic KRAS signaling, we used _targeted homologous recombination to disrupt the oncogenic KRAS, HIF-1α, and HIF-2α gene loci in HCT116 colon cancer cells to generate isogenic HCT116WT KRAS, HCT116HIF-1α-/-, HCT116HIF-2α-/-, and HCT116HIF-1α-/-HIF-2α-/- cell lines.
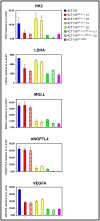
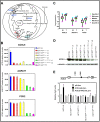
Results: Global gene expression analyses of these cell lines reveal that HIF-1α and HIF-2α work together to modulate cancer metabolism and regulate genes signature overlapping with oncogenic KRAS. Cancer cells with disruption of both HIF-1α and HIF-2α or oncogenic KRAS showed decreased aerobic respiration and ATP production, with increased ROS generation.
Conclusion: Our findings suggest novel strategies for treating tumors with oncogenic KRAS mutations.
Figures


Similar articles
-
Oncogenic KRAS and BRAF differentially regulate hypoxia-inducible factor-1alpha and -2alpha in colon cancer.Cancer Res. 2009 Nov 1;69(21):8499-506. doi: 10.1158/0008-5472.CAN-09-2213. Epub 2009 Oct 20. Cancer Res. 2009. PMID: 19843849 Free PMC article.
-
Multidimensional Screening Platform for Simultaneously _targeting Oncogenic KRAS and Hypoxia-Inducible Factors Pathways in Colorectal Cancer.ACS Chem Biol. 2016 May 20;11(5):1322-31. doi: 10.1021/acschembio.5b00860. Epub 2016 Mar 3. ACS Chem Biol. 2016. PMID: 26938486 Free PMC article.
-
Increased activation of the hypoxia-inducible factor pathway in varicose veins.J Vasc Surg. 2012 May;55(5):1427-39. doi: 10.1016/j.jvs.2011.10.111. Epub 2012 Jan 24. J Vasc Surg. 2012. PMID: 22277691
-
Multiplicity of hypoxia-inducible transcription factors and their connection to the circadian clock in the zebrafish.Physiol Biochem Zool. 2015 Mar-Apr;88(2):146-57. doi: 10.1086/679751. Epub 2015 Jan 14. Physiol Biochem Zool. 2015. PMID: 25730270 Review.
-
Combination therapy _targeting cancer metabolism.Med Hypotheses. 2011 Feb;76(2):169-72. doi: 10.1016/j.mehy.2010.09.008. Epub 2010 Oct 13. Med Hypotheses. 2011. PMID: 20947261 Free PMC article. Review.
Cited by
-
Vitamin C activates pyruvate dehydrogenase (PDH) _targeting the mitochondrial tricarboxylic acid (TCA) cycle in hypoxic KRAS mutant colon cancer.Theranostics. 2021 Jan 25;11(8):3595-3606. doi: 10.7150/thno.51265. eCollection 2021. Theranostics. 2021. PMID: 33664850 Free PMC article.
-
RAGE is essential for oncogenic KRAS-mediated hypoxic signaling in pancreatic cancer.Cell Death Dis. 2014 Oct 23;5(10):e1480. doi: 10.1038/cddis.2014.445. Cell Death Dis. 2014. PMID: 25341034 Free PMC article.
-
Prognostic and Immunotherapeutic Roles of KRAS in Pan-Cancer.Cells. 2022 Apr 22;11(9):1427. doi: 10.3390/cells11091427. Cells. 2022. PMID: 35563733 Free PMC article.
-
Monocarboxylate Transporter 4 in Cancer-Associated Fibroblasts Is a Driver of Aggressiveness in Aerodigestive Tract Cancers.Front Oncol. 2022 Jun 22;12:906494. doi: 10.3389/fonc.2022.906494. eCollection 2022. Front Oncol. 2022. PMID: 35814364 Free PMC article.
-
Antimigratory Effect of Lipophilic Cations Derived from Gallic and Gentisic Acid and Synergistic Effect with 5-Fluorouracil on Metastatic Colorectal Cancer Cells: A New Synthesis Route.Cancers (Basel). 2024 Aug 27;16(17):2980. doi: 10.3390/cancers16172980. Cancers (Basel). 2024. PMID: 39272835 Free PMC article.
References
-
- Bos JL. ras oncogenes in human cancer: a review. Cancer Res. 1989;49(17):4682–9. - PubMed
-
- Friday BB, Adjei AA. K-ras as a _target for cancer therapy. Biochim Biophys Acta. 2005;1756(2):127–44. - PubMed
-
- Weinberg RA. ras Oncogenes and the molecular mechanisms of carcinogenesis. Blood. 1984;64(6):1143–5. - PubMed
Publication types
MeSH terms
Substances
Grants and funding
LinkOut - more resources
Full Text Sources
Other Literature Sources
Research Materials
Miscellaneous

