. 2010 Dec;10(24):4415-30.
doi: 10.1002/pmic.201000298. Epub 2010 Nov 23.

Plasma profiles in active systemic juvenile idiopathic arthritis: Biomarkers and biological implications

Affiliations

Plasma profiles in active systemic juvenile idiopathic arthritis: Biomarkers and biological implications

Xuefeng B Ling et al. Proteomics. 2010 Dec.

Abstract

Systemic juvenile idiopathic arthritis (SJIA) is a chronic arthritis of children characterized by a combination of arthritis and systemic inflammation. There is usually non-specific laboratory evidence of inflammation at diagnosis but no diagnostic test. Normalized volumes from 89/889 2-D protein spots representing 26 proteins revealed a plasma pattern that distinguishes SJIA flare from quiescence. Highly discriminating spots derived from 15 proteins constitute a robust SJIA flare signature and show specificity for SJIA flare in comparison to active polyarticular juvenile idiopathic arthritis or acute febrile illness. We used 7 available ELISA assays, including one to the complex of S100A8/S100A9, to measure levels of 8 of the15 proteins. Validating our DIGE results, this ELISA panel correctly classified independent SJIA flare samples, and distinguished them from acute febrile illness. Notably, data using the panel suggest its ability to improve on erythrocyte sedimentation rate or C-reactive protein or S100A8/S100A9, either alone or in combination in SJIA F/Q discriminations. Our results also support the panel's potential clinical utility as a predictor of incipient flare (within 9 wk) in SJIA subjects with clinically inactive disease. Pathway analyses of the 15 proteins in the SJIA flare versus quiescence signature corroborate growing evidence for a key role for IL-1 at disease flare.


Figures

Figure 1
Figure 1
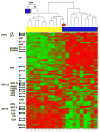
Heatmap display of unsupervised hierarchical clustering of the relative protein abundance (normalized volume data, low-green and high-red) in paired SJIA F/Q plasma samples. The rows of heatmap represent the 89 gel spots derived from 26 different proteins (labeled with SwissProt protein names at the left of the heatmap) with each column of that row representing a different sample from subjects with SJIA flare (blue) and SJIA quiescence (yellow). The SJIA F sample, clustered with the SJIA Q branch, is labeled with a red star.
Figure 2
Figure 2
Construction of robust SJIA flare panel. A. False discovery rate (FDR) analysis of the 26 proteins discriminating SJIA F and Q. X-Y plot of FDR as a function of the number of proteins called significant. B. Heatmap display of unsupervised clustering analyses of expression of the top 15 proteins, ranked by the nearest shrunken centroid algorithm (NSC), in SJIA F/Q, Poly JIA F/Q, SJIA F/KD, SJIA F/FI samples. The misclassified SJIA F sample (Figure 1) is labeled with a red star in each heatmap.
Figure 3
Figure 3
Selection of 7 ELISA bioimarker panel and validation of DIGE results. A. Goodness of separation analysis to select optimal biomarker panel size for the SJIA flare ELISA analysis. Using ELISA data from SJIA F/Q training and test data sets, as indicated, various classifiers of different panel size (feature #) were tested for their goodness of separation between flare (red) and quiescence (green) as shown by the box-whisker graphs. Boxes contain the 50% of values falling between the 25th and 75th percentiles; the horizontal line within the box represents the median value and the “whisker” lines extend to the highest and lowest values. B. ELISA assays validate biomarker observations from DIGE assays. The box-whisker graphs illustrate the spread of the protein abundance of each biomarker from SJIA F/Q, KD and FI samples using either DIGE or ELISA assays. Boxes contain the 50% of values falling between the 25th and 75th percentiles; the horizontal line within the box represents the median value and the “whisker” lines extend to the highest and lowest values.
Figure 4
Figure 4
Linear discriminant analysis of the ELISA-based SJIA flare biomarker panel differentiating SJIA F from Q samples. A. SJIA flare biomarker panel of 7 ELISA assays. Linear discriminant analysis (LDA) was performed with training data from SJIA F (n=17) and Q (n=17) samples evaluated with the biomarker panel. Estimated probabilities for the training (left) and test data (right) are plotted. Samples are partitioned by the true class (upper) and predicted class (lower). The maximum estimated probability for each of the wrongly assigned samples is marked with a red arrow. The trained LDA model was tested using an independent data set from SJIA F (n=10) and Q (n=10) samples. B. The classification results from training and test sets are shown as 2×2 contingency tables. Fisher exact test was used to measure P values of the 2×2 tables with (upper) and without (lower) confounding F samples. C. ROC analyses, using training, test or combined training and testing data sets, to compare the SJIA F and Q classification performance by either ESR, S100A8/S100A9, CRP, the panel of ESR-S100A8/A9-CRP, or SJIA flare ELISA panel, respectively.
Figure 4
Figure 4
Linear discriminant analysis of the ELISA-based SJIA flare biomarker panel differentiating SJIA F from Q samples. A. SJIA flare biomarker panel of 7 ELISA assays. Linear discriminant analysis (LDA) was performed with training data from SJIA F (n=17) and Q (n=17) samples evaluated with the biomarker panel. Estimated probabilities for the training (left) and test data (right) are plotted. Samples are partitioned by the true class (upper) and predicted class (lower). The maximum estimated probability for each of the wrongly assigned samples is marked with a red arrow. The trained LDA model was tested using an independent data set from SJIA F (n=10) and Q (n=10) samples. B. The classification results from training and test sets are shown as 2×2 contingency tables. Fisher exact test was used to measure P values of the 2×2 tables with (upper) and without (lower) confounding F samples. C. ROC analyses, using training, test or combined training and testing data sets, to compare the SJIA F and Q classification performance by either ESR, S100A8/S100A9, CRP, the panel of ESR-S100A8/A9-CRP, or SJIA flare ELISA panel, respectively.
Figure 5
Figure 5
Linear discriminant analysis of the 7-protein SJIA flare biomarker panel, differentiating SJIA F from FI subjects. (A) LDA analysis. SJIA F (n=22) and FI (n=27) subjects were used to develop a binary-class classifier. Samples are partitioned by the true class (upper) and predicted class (lower). The maximum estimated probability for each of the wrongly assigned samples is marked with a red arrow. The LDA classification results are shown as a 2×2 contingency table. Fisher exact test was used to measure the statistical significance (P value) of the 2×2 table. B. ROC analyses. The effectiveness of the biomarker panel to discriminate SJIA F from FI was compared to either S100A8/S100A9, CRP or ESR respectively.
Figure 6
Figure 6
Linear discriminant analysis of the ELISA-based SJIA flare biomarker panel in detection of impending SJIA flare. QF: 10 SJIA quiescent samples drawn within 2–9 weeks of a clinical flare; QQ: 10 SJIA quiescent controls who remained in quiescence for 6 months after the sample was drawn. A. Estimated probabilities for the training (left) and test data (right). Samples are partitioned by the true class (upper) and predicted class (lower). The maximum estimated probability for each of the wrongly assigned samples is marked with a red arrow. SJIA QQ and QF samples were used as training set to develop a binary classifier. The classification results are shown as a 2×2 contingency table, comparing SJIA QF to QQ. Fisher exact test was used to measure the P value of the 2×2 table. B. ROC analyses, using training data sets to compare the SJIA F and Q classification performance by ESR, S100A8/S100A9, CRP or SJIA flare panel.
Figure 7
Figure 7
Pathway analysis of the proteins in the SJIA signature. Data mining software (Ingenuity Systems, www.ingenuity.com, CA) was used with differentially (F vs Q) expressed plasma proteins to identify gene ontology groups and relevant canonical signaling pathways associated with SJIA flare. The intensity of the node color indicates the degree of up- (red) or down- (green) regulation in SJIA F. Nodes are displayed using shapes that represent the functional class of the gene product and different relationships are represented by line type (see key). Relationships are primarily due to co-expression, but can also include phosphorylation/dephosphorylation, proteolysis, activation/deactivation, transcription, binding, inhibition, biochemical modification.
Figure 8
Figure 8
Analysis of the protein profiles differentiating SJIA F from KD subjects. A. Heatmap display of unsupervised clustering analyses of expression of the top 9 proteins with Student’s t test P value < 0.05 comparing SJIA F and KD samples. The mis-clustered SJIA F sample (shown in Figure 1 labeled with a red star) by the SJIA F panel when comparing SJIA F to either SJIA Q or FI is also mis-clustered when comparing SJIA F and KD (labeled with a red star). B. Data mining software (Ingenuity Systems, www.ingenuity.com, CA) was used with differentially (SJIA F vs KD) expressed plasma proteins to identify gene ontology groups and relevant canonical signaling pathways associated with SJIA flare. The intensity of the node color indicates the degree of up- (red) or down- (green) regulation in SJIA F. Nodes are displayed using shapes that represent the functional class of the gene product and different relationships are represented by line type (see key). Relationships are primarily due to co-expression, but can also include phosphorylation/dephosphorylation, proteolysis, activation/deactivation, transcription, binding, inhibition, biochemical modification.

Similar articles

Cited by

References

    1. Weiss JE, Ilowite NT. Juvenile idiopathic arthritis. Pediatr Clin North Am. 2005;52:413–442. vi. - PubMed
    1. Singh-Grewal D, Schneider R, Bayer N, Feldman BM. Predictors of disease course and remission in systemic juvenile idiopathic arthritis: significance of early clinical and laboratory features. Arthritis Rheum. 2006;54:1595–1601. - PubMed
    1. Vastert SJ, Kuis W, Grom AA. Systemic JIA: new developments in the understanding of the pathophysiology and therapy. Best Pract Res Clin Rheumatol. 2009;23:655–664. - PMC - PubMed
    1. Schneider R, Laxer RM. Systemic onset juvenile rheumatoid arthritis. Bailliere’s clinical rheumatology. 1998;12:245–271. - PubMed
    1. Wallace CA, Levinson JE. Juvenile rheumatoid arthritis: outcome and treatment for the 1990s. Rheumatic diseases clinics of North America. 1991;17:891–905. - PubMed

Publication types

  NODES
twitter 2