Selective gene expression by rat gastric corpus epithelium
- PMID: 21177383
- PMCID: PMC3068518
- DOI: 10.1152/physiolgenomics.00193.2010
Selective gene expression by rat gastric corpus epithelium
Abstract
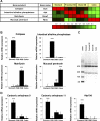
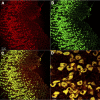
The gastrointestinal (GI) tract is divided into several segments that have distinct functional properties, largely absorptive. The gastric corpus is the only segment thought of as largely secretory. Microarray hybridization of the gastric corpus mucosal epithelial cells was used to compare gene expression with other segments of the columnar GI tract followed by statistical data subtraction to identify genes selectively expressed by the rat gastric corpus mucosa. This provides a means of identifying less obvious specific functions of the corpus in addition to its secretion-related genes. For example, important properties found by this GI tract comparative transcriptome reflect the energy demand of acid secretion, a role in lipid metabolism, the large variety of resident neuroendocrine cells, responses to damaging agents and transcription factors defining differentiation of its epithelium. In terms of overlap of gastric corpus genes with the rest of the GI tract, the distal small bowel appears to express many of the gastric corpus genes in contrast to proximal small and large bowel. This differential map of gene expression by the gastric corpus epithelium will allow a more detailed description of major properties of the gastric corpus and may lead to the discovery of gastric corpus cell differentiation genes and those mis-regulated in gastric carcinomas.
Figures


Similar articles
-
Quantitative distribution of brush cells in the rat gastrointestinal tract: brush cell population coincides with NaHCO3 secretion.Med Mol Morphol. 2011 Mar;44(1):7-14. doi: 10.1007/s00795-009-0488-1. Epub 2011 Mar 23. Med Mol Morphol. 2011. PMID: 21424931
-
Cellular prion protein is expressed in a subset of neuroendocrine cells of the rat gastrointestinal tract.J Histochem Cytochem. 2004 Oct;52(10):1357-65. doi: 10.1177/002215540405201012. J Histochem Cytochem. 2004. PMID: 15385582
-
Comprehensive analysis of localization of 78 solute carrier genes throughout the subsections of the rat gastrointestinal tract.Biochem Biophys Res Commun. 2011 Aug 12;411(4):702-7. doi: 10.1016/j.bbrc.2011.07.005. Epub 2011 Jul 13. Biochem Biophys Res Commun. 2011. PMID: 21781957
-
Development, validation and implementation of an in vitro model for the study of metabolic and immune function in normal and inflamed human colonic epithelium.Dan Med J. 2015 Jan;62(1):B4973. Dan Med J. 2015. PMID: 25557335 Review.
-
The impact of asymmetric dimethylarginine (ADAMA), the endogenous nitric oxide (NO) synthase inhibitor, to the pathogenesis of gastric mucosal damage.Curr Pharm Des. 2013;19(1):90-7. doi: 10.2174/13816128130113. Curr Pharm Des. 2013. PMID: 22950506 Review.
Cited by
-
Exploring Differential Transcriptome between Jejunal and Cecal Tissue of Broiler Chickens.Animals (Basel). 2019 May 7;9(5):221. doi: 10.3390/ani9050221. Animals (Basel). 2019. PMID: 31067716 Free PMC article.
-
Age-related expression of the polymeric immunoglobulin receptor (pIgR) in the gastric mucosa of young pigs.PLoS One. 2013 Nov 13;8(11):e81473. doi: 10.1371/journal.pone.0081473. eCollection 2013. PLoS One. 2013. PMID: 24236214 Free PMC article.
-
Differential gene expression in the oxyntic and pyloric mucosa of the young pig.PLoS One. 2014 Oct 30;9(10):e111447. doi: 10.1371/journal.pone.0111447. eCollection 2014. PLoS One. 2014. PMID: 25357124 Free PMC article.
-
The effects of starter microbiota and the early life feeding of medium chain triglycerides on the gastric transcriptome profile of 2- or 3-week-old cesarean delivered piglets.J Anim Sci Biotechnol. 2017 Nov 2;8:82. doi: 10.1186/s40104-017-0213-1. eCollection 2017. J Anim Sci Biotechnol. 2017. PMID: 29118979 Free PMC article.
-
Quantitative Shotgun Proteomics Unveils Candidate Novel Esophageal Adenocarcinoma (EAC)-specific Proteins.Mol Cell Proteomics. 2017 Jun;16(6):1138-1150. doi: 10.1074/mcp.M116.065078. Epub 2017 Mar 23. Mol Cell Proteomics. 2017. PMID: 28336725 Free PMC article.
References
-
- Alnouti Y, Klaassen CD. Tissue distribution, ontogeny, and regulation of aldehyde dehydrogenase (Aldh) enzymes mRNA by prototypical microsomal enzyme inducers in mice. Toxicol Sci 101: 51–64, 2008 - PubMed
-
- Andersson N, Skrtic SM, Hakanson R, Ohlsson C. A gene expression fingerprint of mouse stomach ECL cells. Biochem Biophys Res Commun 332: 404–410, 2005 - PubMed
-
- Bouckenooghe T, Remacle C, Reusens B. Is taurine a functional nutrient? Curr Opin Clin Nutr Metab Care 9: 728–733, 2006 - PubMed
-
- Bradley KK, Hatton WJ, Mason HS, Walker RL, Flynn ER, Kenyon JL, Horowitz B. Kir3.1/3.2 encodes an I(KACh)-like current in gastrointestinal myocytes. Am J Physiol Gastrointest Liver Physiol 278: G289–G296, 2000 - PubMed
Publication types
MeSH terms
Grants and funding
LinkOut - more resources
Full Text Sources

