Knockdown of oncogenic KRAS in non-small cell lung cancers suppresses tumor growth and sensitizes tumor cells to _targeted therapy
- PMID: 21306997
- PMCID: PMC3061393
- DOI: 10.1158/1535-7163.MCT-10-0750
Knockdown of oncogenic KRAS in non-small cell lung cancers suppresses tumor growth and sensitizes tumor cells to _targeted therapy
Abstract
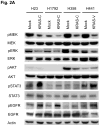
Oncogenic KRAS is found in more than 25% of lung adenocarcinomas, the major histologic subtype of non-small cell lung cancer (NSCLC), and is an important _target for drug development. To this end, we generated four NSCLC lines with stable knockdown selective for oncogenic KRAS. As expected, stable knockdown of oncogenic KRAS led to inhibition of in vitro and in vivo tumor growth in the KRAS-mutant NSCLC cells, but not in NSCLC cells that have wild-type KRAS (but mutant NRAS). Surprisingly, we did not see large-scale induction of cell death and the growth inhibitory effect was not complete. To further understand the ability of NSCLCs to grow despite selective removal of mutant KRAS expression, we conducted microarray expression profiling of NSCLC cell lines with or without mutant KRAS knockdown and isogenic human bronchial epithelial cell lines with and without oncogenic KRAS. We found that although the mitogen-activated protein kinase pathway is significantly downregulated after mutant KRAS knockdown, these NSCLCs showed increased levels of phospho-STAT3 and phospho-epidermal growth factor receptor, and variable changes in phospho-Akt. In addition, mutant KRAS knockdown sensitized the NSCLCs to p38 and EGFR inhibitors. Our findings suggest that _targeting oncogenic KRAS by itself will not be sufficient treatment, but may offer possibilities of combining anti-KRAS strategies with other _targeted drugs.
Conflict of interest statement
All authors have no financial or personal relationships with other people or organizations that could inappropriately influence our work.
Figures


Similar articles
-
Atorvastatin overcomes gefitinib resistance in KRAS mutant human non-small cell lung carcinoma cells.Cell Death Dis. 2013 Sep 26;4(9):e814. doi: 10.1038/cddis.2013.312. Cell Death Dis. 2013. PMID: 24071646 Free PMC article.
-
Oncogenic KRAS-induced epiregulin overexpression contributes to aggressive phenotype and is a promising therapeutic _target in non-small-cell lung cancer.Oncogene. 2013 Aug 22;32(34):4034-42. doi: 10.1038/onc.2012.402. Epub 2012 Sep 10. Oncogene. 2013. PMID: 22964644 Free PMC article.
-
Oncogenic KRAS-induced interleukin-8 overexpression promotes cell growth and migration and contributes to aggressive phenotypes of non-small cell lung cancer.Int J Cancer. 2012 Apr 15;130(8):1733-44. doi: 10.1002/ijc.26164. Epub 2011 Aug 3. Int J Cancer. 2012. PMID: 21544811 Free PMC article.
-
Personalized medicine in non-small-cell lung cancer: is KRAS a useful marker in selecting patients for epidermal growth factor receptor-_targeted therapy?J Clin Oncol. 2010 Nov 1;28(31):4769-77. doi: 10.1200/JCO.2009.27.4365. Epub 2010 Oct 4. J Clin Oncol. 2010. PMID: 20921461 Review.
-
The genetics and biology of KRAS in lung cancer.Chin J Cancer. 2013 Feb;32(2):63-70. doi: 10.5732/cjc.012.10098. Epub 2012 Jul 2. Chin J Cancer. 2013. PMID: 22776234 Free PMC article. Review.
Cited by
-
K-Ras(G12C) inhibitors allosterically control GTP affinity and effector interactions.Nature. 2013 Nov 28;503(7477):548-51. doi: 10.1038/nature12796. Epub 2013 Nov 20. Nature. 2013. PMID: 24256730 Free PMC article.
-
Atorvastatin overcomes gefitinib resistance in KRAS mutant human non-small cell lung carcinoma cells.Cell Death Dis. 2013 Sep 26;4(9):e814. doi: 10.1038/cddis.2013.312. Cell Death Dis. 2013. PMID: 24071646 Free PMC article.
-
Dependence on the MUC1-C oncoprotein in non-small cell lung cancer cells.Mol Cancer Ther. 2011 May;10(5):806-16. doi: 10.1158/1535-7163.MCT-10-1050. Epub 2011 Mar 18. Mol Cancer Ther. 2011. PMID: 21421804 Free PMC article.
-
Transient but not stable ZEB1 knockdown dramatically inhibits growth of malignant pleural mesothelioma cells.Ann Surg Oncol. 2012 Jul;19 Suppl 3(Suppl 3):S634-45. doi: 10.1245/s10434-011-2142-0. Epub 2011 Nov 16. Ann Surg Oncol. 2012. PMID: 22086445 Free PMC article.
-
Modulation of EZH2 Expression by MEK-ERK or PI3K-AKT Signaling in Lung Cancer Is Dictated by Different KRAS Oncogene Mutations.Cancer Res. 2016 Feb 1;76(3):675-85. doi: 10.1158/0008-5472.CAN-15-1141. Epub 2015 Dec 16. Cancer Res. 2016. PMID: 26676756 Free PMC article.
References
-
- Sekido Y, Fong KM, Minna JD. Molecular genetics of lung cancer. Annu Rev Med. 2003;54:73–87. - PubMed
-
- Sato M, Shames DS, Gazdar AF, Minna JD. A translational view of the molecular pathogenesis of lung cancer. J Thorac Oncol. 2007 Apr;2(4):327–43. - PubMed
-
- Downward J. _targeting RAS signalling pathways in cancer therapy. Nat Rev Cancer. 2003 Jan;3(1):11–22. - PubMed
-
- Suda K, Tomizawa K, Mitsudomi T. Biological and clinical significance of KRAS mutations in lung cancer: an oncogenic driver that contrasts withEGFR mutation. Cancer Metastasis Rev. 2010 Mar;29(1):49–60. - PubMed
Publication types
MeSH terms
Substances
Grants and funding
LinkOut - more resources
Full Text Sources
Other Literature Sources
Research Materials
Miscellaneous

