. 2011 Apr 1;25(7):717-29.
doi: 10.1101/gad.2016111. Epub 2011 Mar 15.

Pancreatic cancers require autophagy for tumor growth

Affiliations

Pancreatic cancers require autophagy for tumor growth

Shenghong Yang et al. Genes Dev. .

Abstract

Macroautophagy (autophagy) is a regulated catabolic pathway to degrade cellular organelles and macromolecules. The role of autophagy in cancer is complex and may differ depending on tumor type or context. Here we show that pancreatic cancers have a distinct dependence on autophagy. Pancreatic cancer primary tumors and cell lines show elevated autophagy under basal conditions. Genetic or pharmacologic inhibition of autophagy leads to increased reactive oxygen species, elevated DNA damage, and a metabolic defect leading to decreased mitochondrial oxidative phosphorylation. Together, these ultimately result in significant growth suppression of pancreatic cancer cells in vitro. Most importantly, inhibition of autophagy by genetic means or chloroquine treatment leads to robust tumor regression and prolonged survival in pancreatic cancer xenografts and genetic mouse models. These results suggest that, unlike in other cancers where autophagy inhibition may synergize with chemotherapy or _targeted agents by preventing the up-regulation of autophagy as a reactive survival mechanism, autophagy is actually required for tumorigenic growth of pancreatic cancers de novo, and drugs that inactivate this process may have a unique clinical utility in treating pancreatic cancers and other malignancies with a similar dependence on autophagy. As chloroquine and its derivatives are potent inhibitors of autophagy and have been used safely in human patients for decades for a variety of purposes, these results are immediately translatable to the treatment of pancreatic cancer patients, and provide a much needed, novel vantage point of attack.


Figures
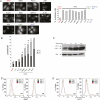
Figure 1.
Figure 1.
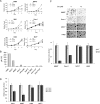
PDAC have high levels of basal autophagy. (A) PDAC cells and controls (HPDE [immortalized normal HPDEs], MCF7 [breast cancer], and H460 [lung cancer]) were infected with a retrovirus expressing GFP-LC3, grown in complete media in the presence of serum, and then fixed and analyzed by fluorescence microscopy for the presence of LC3 dots, which represent autophagic vesicles. Numerous discrete autophagic puncta were present in PDAC cells, while each of the control cell lines showed only a diffuse expression of GFP. The percentage of autophagic cells (defined as the presence of more than five foci) is shown in the adjacent histogram. The differences between all eight of the PDAC lines as compared with HPDE cells are statistically significant (P < 0.05 by the Fisher's exact test). Bar, 20 μM. (B) PDAC cells and controls were cultured under normal growth conditions, and the number of LC3 puncta per cell was determined in the absence and presence of the autophagy inhibitor CQ. As in A, note the robust increase in foci of PDAC cells versus HPDE, H460, and MCF7 (dark-gray bars). (^) Statistical significance compared with HPDE cells. Autophagic flux is elevated in PDAC, as evidenced by the increase in puncta per cell when treated with CQ (light-gray bars show increase in foci upon CQ treatment). Asterisk represents a statistically significant increase upon CQ treatment compared with untreated cells. (C) Autophagic flux in 8988T PDAC cells shown by a robust increase in LC3-II expression upon inhibition of lysosomal proteases with E64d + pepstatin A as well as CQ at various time points. (D) Long-term protein degradation was assessed in 8988T cells using a GFP-Neo fusion protein that enters the long-term protein degradation pathway. GFP expression was monitored by FACS. The left panel shows decreased GFP expression on day 1 and day 2 as compared with day 0, indicating activated autophagy under basal conditions. The right panel demonstrates that CQ, an inhibitor of autophagy, blocks the long-term protein degradation in these cells. (E) Long-term protein degradation was assessed in MCF7 cells, as in D. Note the minimal change in GFP expression, indicating low levels of basal autophagy. This is not affected by the addition of CQ.
Figure 2.
Figure 2.
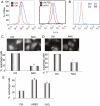
(A) Activated autophagy was assessed by IHC for cleaved LC3 at different stages of primary PDAC. LC3 is low or absent in normal exocrine pancreas and in low-grade PanIN-1 and PanIN-2 lesions, whereas staining is up-regulated and exhibits a vesicular staining pattern in all high-grade PanIN-3 (A) and PDAC (B). (N) Nerve bundle with tumor infiltration, demonstrating robust LC3 expression. (C) High-powered magnification of a tumor cell showing vesicular staining (arrows) suggestive of autophagosomes. (Nu) Nucleus. (D) A representative islet showing high levels of vesicular staining and consistent with known constitutive autophagy in β cells. (E) Transmission electron microscopy of a pancreatic tumor showing an autophagosome fusing to a lysosome (panel i; [arrow] autophagosome; [arrowhead] lysosome), and autophagosomes fused to lysosomes (autolysosomes) (panels ii,iii; arrow).
Figure 3.
Figure 3.
Inhibition of autophagy in PDAC cell lines attenuates growth and tumorigenicity in vitro. (A) Growth curves of four different PDAC cell lines (8988T, BXPC3, 8902, and Panc1) and control cell lines H460 and MCF7 treated with CQ (6.25 μM and 12.5 μM) to inhibit autophagy or with PBS as a control. The PDAC cells showed a dose-dependent robust suppression of growth, whereas H460 and MCF7 cells with low basal autophagy were only minimally affected. (B) IC50 of CQ in micromolar in a panel of PDAC lines and H460 and MCF7 cells. Note the low IC50 values for the PDAC lines as compared with MCF7 and H460. (C) Soft agar assays were performed to assess for the ability of CQ (10 μM) to inhibit anchorage-independent growth. Colony formation was suppressed in 8988T and Panc1 cells, but not MCF7 and H460 cells. The histogram below shows quantitation of these assays relative to untreated cells. Error bars represent triplicates. (D) Bafilomycin A1, an inhibitor of lysosomal acidication and autophagy, attenuates PDAC anchorage-independent growth. Cells were seeded in soft agar and treated with 5 nM bafilomycin A1 (charcoal bar) or vehicle (light-gray bar). Data are expressed relative to control, with error bars representing standard deviations of triplicates. Note the robust reduction in Panc1 and 8988T PDAC cells but not in H460 and MCF7 cells.
Figure 4.
Figure 4.
(A) Cells were transfected with two different siRNAs against the essential autophagy gene ATG5 (siA and B) or with a control, scrambled siRNA. Shown is a representative Western blot comparing ATG5 expression with a control siRNA. The bottom panel is an actin loading control. (B) ATG5 siRNA transfected 8988T cells were assessed for basal autophagy using the GFP-LC3 assay. The histogram below shows the percentage of autophagic cells (more than five puncta), and reveals statistically significant reductions in the siATG5-expressing cells (asterisks) compared with the control (P < 0.05 Fisher's exact test). (C) Cells were transfected with control or siRNAs to ATG5 and soft agar were assays performed. Both siRNAs significantly inhibited anchorage-independent growth of 8988T PDAC cells but not H460 cells. The histogram shows quantitation expressed relative to control. Error bars represent triplicates. (D) Two shRNAs to ATG5 (HP2 and HP7) suppress expression of ATG5. (E) ATG5 shRNAs decrease soft agar growth of 8988T PDAC cells, corresponding to the efficiency of knockdown. Results shown are from three independent experiments performed in triplicate. Asterisks show a statistically significant decrease as compared with control (P < 0.05 by t-test).
Figure 5.
Figure 5.
Autophagy is regulated by ROS in PDAC. (A) The left panel shows 8988T cells treated with CQ (25 μM) to inhibit autophagy and stained with DCF-DA to determine ROS levels by measuring fluorescence by FACS. Note the greater ROS levels, indicated by the increased fluorescence upon CQ treatment (blue curve). The right panel shows a similar increase in ROS when autophagy is inhibited by siRNA to ATG5. (B) Inhibition of autophagy by treatment with CQ increases mitochondrial ROS, as evidenced by increased MitoSOX staining. (C) Treatment of 8988T PDAC cells with 3 mM NAC diminishes basal autophagy, shown by the disappearance of GFP-LC3-labeled autophagosomes and the presence of only diffuse signal in the top panels. Below, a histogram shows quantitation of these results, expressed as percentage of autophagic cells. Asterisks indicate that the difference is statistically significant (P < 0.05 by Fisher's exact test). (D) Treatment of Panc1 cells with NAC attenuates basal autophagy similar to 8988T cells. The histogram below shows quantitation of the assay, with the asterisk representing a statistically significant decrease compared with control by Fisher's exact test (P < 0.05). (E) Treatment of HPDE immortalized human ductal cells with 0.5 mM hydrogen peroxide (H2O2) leads to a significant increase in autophagy, shown by a significant increase in GFP-LC3 autophagosomes (asterisks show a significant difference as compared with control by Fisher's exact test; P < 0.05). (HBSS) Hank's buffered salt solution (serum and amino acid starvation) is included as a control for autophagy induction.
Figure 6.
Figure 6.
(A) Inhibition of autophagy in 8988T PDAC cells with CQ leads to an increase in DNA damage. The top panels show the results from cells expressing a GFP-53BP1 fusion construct. Note the increase in foci upon CQ treatment, indicating an increase in DNA DSBs. This was mitigated by concurrent treatment with NAC. The histogram below shows quantitation from a representative assay, with a single asterisk representing statistical significance compared with control and a double asterisk representing statistical significance compared with CQ treatment (P < 0.05 Fisher's exact test). (B) Inhibition of autophagy using two siRNAs to ATG5 (siA and B) increases DNA DSBs, measured by 53BP1 foci (charcoal bars) and expressed as percentage of cells with >10 foci. A single asterisk indicates that the increase in 53BP1 foci is statistically significant compared with control (P < 0.05 Fisher's exact test). The light-gray bars show the effect of NAC on 53BP1 foci in a particular experiment. The double asterisk indicates a statistically significant decrease in foci as compared with the corresponding untreated cells (charcoal bar), demonstrating that NAC inhibits the DNA damage caused by autophagy inhibition. (C) 8988T PDAC cells were treated with CQ and subjected to a neutral comet assay to measure the amount of DSBs. Data are expressed as average tail moment (tail moment is the tail length multiplied by the percentage of DNA in the tail). Note the increase upon treatment with CQ as compared with control (asterisk indicates statistical significance; P < 0.05 by t-test). (D) Clonogenic survival assays were performed on 8988T cells transfected with either a control siRNA (charcoal bar) or an siRNA to ATG5 (light-gray bar), and results are expressed as surviving fraction relative to control. Note the significant reduction in surviving fraction with inhibition of autophagy by RNAi. Identical assays were performed in the presence of 1 mM NAC to inhibit ROS. This led to an increase in surviving fraction in ATG5-suppressed cells, indicating a partial rescue by NAC. (E) 8988T cells were treated with CQ with (broken line) or without (solid line) NAC, and proliferation was measured. There was a robust increase in growth with concomitant NAC treatment.
Figure 7.
Figure 7.
PDAC metabolism is altered by autophagy inhibition. (A) Oxidative phosphorylation, as measured by oxygen consumption in 8988T PDAC cells. (Blue) Control; (red) CQ. CQ treatment robustly decreases the basal oxygen consumption ratio (OCR), normalized to cell number or protein concentration. Data represent the mean of four independent experiments, with error bars representing standard deviations. The graph shows basal mitochondrial respiration (3 mM glucose) (arrow) and leak (respiration nonlinked to mitochondrial ATP synthesis, 2 μM oligomycin) (line A), nonmitochondrial OCR (2 μM anti-mycin A) (line C) and respiration after FCCP (5 μM) (line B). Identical experiments as in A were performed using two shRNAs to ATG5 (HP2 and HP7). Both shRNAs decrease basal oxygen consumption similar to CQ. Data represent the mean of three independent experiments. (C) 8988T cells were treated with CQ, and glucose uptake was measured and compared with control cells (left panel) and lactate secretion (right panel). Note the significant increase in glucose uptake as well as increased lactate secretion in cells in which autophagy is inhibited by CQ, indicating an increase in glycolysis. (Asterisk shows a statistically significant change by t-test.) (D) Inhibition of autophagy results in a decrease in intracellular ATP. Results are expressed as a fold of control and are normalized to protein concentration. Data are from three independent experiments, with error bars representing standard deviations. The asterisk shows a statistically significant decrease compared with control by a t-test. (E) Autophagy inhibition does not result in an increase in mitochondrial mass. Western blotting for TOM20 or Porin (mitochondrial proteins) does not show increases upon inhibition of lysosomal proteases plus CQ for the indicated time periods. Mitochondrial mass was also determined by quantitative real-time PCR using two different primers for mitochondrial DNA (a and b). Data shown are from two independent experiments performed in triplicate. Expression was normalized using primers for nuclear-derived DNA and expressed as fold of control. There was no significant increase in mitochondrial mass in response to CQ treatment. (F) Mitochondrial membrane potential was measured using JC1. The uncoupler CCCP was included as a positive control for depolarized mitochondria. The top panel shows a representative experiment showing no increase in mitochondrial membrane depolarization upon CQ treatment. The graph below shows data from two independent experiments. (G) The addition of methyl pyruvate (MP) protects PDAC cells from autophagy inhibition by CQ. 8988T cells were treated with the indicated concentration of MP and subjected to IC50 assays with increasing doses of CQ. As depicted in the bar graph, the IC50s markedly increase with increasing concentrations of MP, indicating that it is protecting cells from the inhibitory effects of CQ.
Figure 8.
Figure 8.
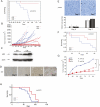
Inhibition of autophagy using CQ robustly suppresses PDAC tumor growth in vivo. (A) 8988T PDAC cells were grown as xenograft tumors in the flanks of nude mice. When tumors reached 0.5–1 cm, mice were divided into two treatment groups of 10 mice per group (PBS or 60 mg/kg per day CQ intraperitoneally). Pancreatic cancer survival analysis is depicted in graphic form. (Blue) Control; (red) CQ. Note the increased survival of the CQ-treated cohort (P = 0.0012 by the log-rank test). Only one mouse died of pancreatic cancer in the CQ cohort over a period of >6 mo. (B) Tumor volumes were measured twice per week and plotted as a function of time. Each line represents the growth kinetics of an individual tumor. (Blue) Control; (red) CQ. Note the CQ-treated tumors segregate together at the bottom of the graph, indicating slower growth kinetics. Multiple tumors have completely regressed in the CQ cohort. (C) Western blot on two untreated control xenografts and two from mice treated with CQ. Notice the increase in p62 expression, indicating autophagy was successfully inhibited in the tumor. Actin is shown below as a loading control. (D) IHC analysis of xenografts harvested at different time points after CQ treatment (days 0, 1, 2, and 7). Similar to the Western blot analysis, p62 expression is increased over time, as indicated by the stronger brown staining, as compared with untreated (day 0). (E) IHC was performed on xenografts to assess γH2AX expression, a marker for DNA damage. This expression, depicted by brown nuclear staining, is highly up-regulated in the CQ-treated xenografts, indicating an increase in DNA damage. Shown here is a representative image from a xenograft harvested from a mouse treated with CQ for 7 d or an untreated control. The histogram below shows quantitation of these results from two control tumors and two treated tumors, shown as the average number of positive staining cells per 20× field (at least 10 fields were counted for each sample). Error bars represent standard deviations. (F) CQ treatment prolongs PDAC-specific survival in mice carrying Panc1 xenografts. Experiment was performed as in A, with 10 mice per group. The difference in survival was significant by log-rank test. Sixty percent of the treated mice were alive at 90 d compared with 10% of the controls. (G) Suppression of ATG5 expression by shRNAs decreases 8988T xenograft growth. Cells were infected with two different shRNAs to ATG5 (HP2 and HP7) or control retroviruses and injected into the flanks of nude mice (n = 12 for each group). Tumor volume was measured weekly. Note the robust decrease in volume as compared with control. This was statistically significant by a t-test for HP2 versus Ctrl ([*] P = 0.02) and a strong statistical trend for HP7 versus Ctrl ([^] P = 0.06). (H) Survival is prolonged in the Kras-driven genetic mouse model of PDAC by CQ treatment. Mice began treatment at 8 wk of age (n = 8). Survival is compared with an IP PBS-treated control cohort of identical genotype (n = 12). The difference in survival is significant by log-rank test.

Similar articles

Cited by

References

    1. Amaravadi RK, Yu D, Lum JJ, Bui T, Christophorou MA, Evan GI, Thomas-Tikhonenko A, Thompson CB 2007. Autophagy inhibition enhances therapy-induced apoptosis in a Myc-induced model of lymphoma. J Clin Invest 117: 326–336 - PMC - PubMed
    1. Bardeesy N, Aguirre AJ, Chu GC, Cheng KH, Lopez LV, Hezel AF, Feng B, Brennan C, Weissleder R, Mahmood U, et al. 2006. Both p16(Ink4a) and the p19(Arf)–p53 pathway constrain progression of pancreatic adenocarcinoma in the mouse. Proc Natl Acad Sci 103: 5947–5952 - PMC - PubMed
    1. Bellodi C, Lidonnici MR, Hamilton A, Helgason GV, Soliera AR, Ronchetti M, Galavotti S, Young KW, Selmi T, Yacobi R, et al. 2009. _targeting autophagy potentiates tyrosine kinase inhibitor-induced cell death in Philadelphia chromosome-positive cells, including primary CML stem cells. J Clin Invest 119: 1109–1123 - PMC - PubMed
    1. Ben-Josef E, Lawrence TS 2008. Chemoradiotherapy for unresectable pancreatic cancer. Int J Clin Oncol 13: 121–126 - PubMed
    1. Bjorkoy G, Lamark T, Pankiv S, Øvervatn A, Brech A, Johansen T 2009. Monitoring autophagic degradation of p62/SQSTM1. Methods Enzymol 452: 181–197 - PubMed

Publication types

  NODES
Note 12
twitter 2