Noninvasive measurement of plasma glucose from exhaled breath in healthy and type 1 diabetic subjects
- PMID: 21467303
- PMCID: PMC3118590
- DOI: 10.1152/ajpendo.00634.2010
Noninvasive measurement of plasma glucose from exhaled breath in healthy and type 1 diabetic subjects
Abstract
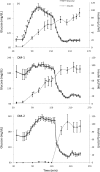
Effective management of diabetes mellitus, affecting tens of millions of patients, requires frequent assessment of plasma glucose. Patient compliance for sufficient testing is often reduced by the unpleasantness of current methodologies, which require blood samples and often cause pain and skin callusing. We propose that the analysis of volatile organic compounds (VOCs) in exhaled breath can be used as a novel, alternative, noninvasive means to monitor glycemia in these patients. Seventeen healthy (9 females and 8 males, 28.0 ± 1.0 yr) and eight type 1 diabetic (T1DM) volunteers (5 females and 3 males, 25.8 ± 1.7 yr) were enrolled in a 240-min triphasic intravenous dextrose infusion protocol (baseline, hyperglycemia, euglycemia-hyperinsulinemia). In T1DM patients, insulin was also administered (using differing protocols on 2 repeated visits to separate the effects of insulinemia on breath composition). Exhaled breath and room air samples were collected at 12 time points, and concentrations of ~100 VOCs were determined by gas chromatography and matched with direct plasma glucose measurements. Standard least squares regression was used on several subsets of exhaled gases to generate multilinear models to predict plasma glucose for each subject. Plasma glucose estimates based on two groups of four gases each (cluster A: acetone, methyl nitrate, ethanol, and ethyl benzene; cluster B: 2-pentyl nitrate, propane, methanol, and acetone) displayed very strong correlations with glucose concentrations (0.883 and 0.869 for clusters A and B, respectively) across nearly 300 measurements. Our study demonstrates the feasibility to accurately predict glycemia through exhaled breath analysis over a broad range of clinically relevant concentrations in both healthy and T1DM subjects.
Figures


Similar articles
-
Improved predictive models for plasma glucose estimation from multi-linear regression analysis of exhaled volatile organic compounds.J Appl Physiol (1985). 2009 Jul;107(1):155-60. doi: 10.1152/japplphysiol.91657.2008. Epub 2009 May 7. J Appl Physiol (1985). 2009. PMID: 19423833 Free PMC article.
-
Exhaled methyl nitrate as a noninvasive marker of hyperglycemia in type 1 diabetes.Proc Natl Acad Sci U S A. 2007 Oct 2;104(40):15613-8. doi: 10.1073/pnas.0706533104. Epub 2007 Sep 25. Proc Natl Acad Sci U S A. 2007. PMID: 17895380 Free PMC article.
-
Analysis of ketone bodies in exhaled breath and blood of ten healthy Japanese at OGTT using a portable gas chromatograph.J Breath Res. 2014 Nov 24;8(4):046008. doi: 10.1088/1752-7155/8/4/046008. J Breath Res. 2014. PMID: 25417653
-
Glucose prediction by analysis of exhaled metabolites - a systematic review.BMC Anesthesiol. 2014 Jun 17;14:46. doi: 10.1186/1471-2253-14-46. eCollection 2014. BMC Anesthesiol. 2014. PMID: 24963286 Free PMC article. Review.
-
The clinical potential of exhaled breath analysis for diabetes mellitus.Diabetes Res Clin Pract. 2012 Aug;97(2):195-205. doi: 10.1016/j.diabres.2012.02.006. Epub 2012 Mar 10. Diabetes Res Clin Pract. 2012. PMID: 22410396 Free PMC article. Review.
Cited by
-
UV/Vis+ photochemistry database: Structure, content and applications.J Quant Spectrosc Radiat Transf. 2020 Sep 1;253:10.1016/j.jqsrt.2020.107056. doi: 10.1016/j.jqsrt.2020.107056. J Quant Spectrosc Radiat Transf. 2020. PMID: 34121770 Free PMC article.
-
Significance of Exhaled Breath Test in Clinical Diagnosis: A Special Focus on the Detection of Diabetes Mellitus.J Med Biol Eng. 2016;36(5):605-624. doi: 10.1007/s40846-016-0164-6. Epub 2016 Oct 11. J Med Biol Eng. 2016. PMID: 27853412 Free PMC article. Review.
-
Monitoring states of altered carbohydrate metabolism via breath analysis: are times ripe for transition from potential to reality?Curr Opin Clin Nutr Metab Care. 2013 Jul;16(4):466-72. doi: 10.1097/MCO.0b013e328361f91f. Curr Opin Clin Nutr Metab Care. 2013. PMID: 23739629 Free PMC article. Review.
-
Exploring Salivary Metabolic Alterations in Type 2 Diabetes: Implications for Dental Caries and Potential Influences of HbA1c and Vitamin D Levels.Metabolites. 2024 Jun 30;14(7):372. doi: 10.3390/metabo14070372. Metabolites. 2024. PMID: 39057695 Free PMC article.
-
Noninvasive monitoring of glucose levels: is exhaled breath the answer?J Diabetes Sci Technol. 2012 May 1;6(3):659-64. doi: 10.1177/193229681200600322. J Diabetes Sci Technol. 2012. PMID: 22768898 Free PMC article. Review.
References
-
- Aschmann SM, Long WD, Atkinson R. Pressure dependence of pentyl nitrate formation from the OH Radical-initiated reaction of n-pentane in the presence of NO. J Phys Chem A 110: 6617–6622, 2006 - PubMed
-
- Blake D, Iwanaga K, Novak B, Meinardi S, Pescatello A, Cooper DM, Galassetti PR. Effect of a high-fat meal on resting and post-exercise exhaled methyl nitrate (CH3ONO2) profile in children (Abstract). Diabetes 53: A372, 2004
-
- Bland JM, Altman DG. Statistical methods for assessing agreement between two methods of clinical measurement. Lancet: 307–310, 1986 - PubMed
Publication types
MeSH terms
Substances
Grants and funding
LinkOut - more resources
Full Text Sources
Other Literature Sources
Medical

