. 2011 May 16;193(4):755-67.
doi: 10.1083/jcb.201102092.

Two MAPK-signaling pathways are required for mitophagy in Saccharomyces cerevisiae

Affiliations

Two MAPK-signaling pathways are required for mitophagy in Saccharomyces cerevisiae

Kai Mao et al. J Cell Biol. .

Abstract

Macroautophagy (hereafter referred to simply as autophagy) is a catabolic pathway that mediates the degradation of long-lived proteins and organelles in eukaryotic cells. The regulation of mitochondrial degradation through autophagy plays an essential role in the maintenance and quality control of this organelle. Compared with our understanding of the essential function of mitochondria in many aspects of cellular metabolism such as energy production and of the role of dysfunctional mitochondria in cell death, little is known regarding their degradation and especially how upstream signaling pathways control this process. Here, we report that two mitogen-activated protein kinases (MAPKs), Slt2 and Hog1, are required for mitophagy in Saccharomyces cerevisiae. Slt2 is required for the degradation of both mitochondria and peroxisomes (via pexophagy), whereas Hog1 functions specifically in mitophagy. Slt2 also affects the recruitment of mitochondria to the phagophore assembly site (PAS), a critical step in the packaging of cargo for selective degradation.


Figures

Figure 1.
Figure 1.
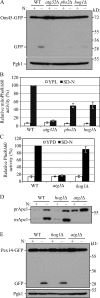
Slt2 is involved in mitophagy and pexophagy, but not bulk autophagy or the Cvt pathway. (A) The Slt2 MAPK pathway. (B) Om45-GFP processing is blocked in bck1Δ, mkk1/2Δ, and slt2Δ mutants. OM45 was chromosomally tagged with GFP in the wild-type (TKYM22), atg32Δ (TKYM130), bck1Δ (KWY51), mkk1Δ mkk2Δ (KDM1303), and slt2Δ (KDM1305) strains. Cells were cultured in YPL to mid-log phase, then shifted to SD-N and incubated for 6 h. Samples were taken before (+) and after (−) starvation. Immunoblotting was done with anti-YFP antibody and the positions of full-length Om45-GFP and free GFP are indicated. Anti-Pgk1 was used as a loading control. (C) Om45-GFP processing is blocked in pkc1 mutants. Om45-GFP processing was examined in wild-type (KDM2023), pkc1-1 (KDM2011), pkc1-2 (KDM2009), pkc1-3 (KDM2010), and pkc1-4 (KDM2012) strains. Cells were cultured in YPL at 24°C to mid-log phase. For each strain, the culture was then divided into two parts. Both were shifted to SD-N and one half was incubated for 6 h at 24°C while the other was shifted to 35°C. Protein extracts were probed with anti-YFP antibody. (D) MitoPho8Δ60 activity is reduced in Slt2 pathway mutants. Wild-type (KWY20), atg32Δ (KWY22), bck1Δ (KWY33), mkk1/2Δ (KDM1003), and slt2Δ (KDM1008) cells were cultured as in A. The mitoPho8Δ60 assay was performed as described in Materials and methods. Error bars, standard deviation (SD) were obtained from three independent repeats. (E) The Pho8Δ60 activity (nonspecific autophagy) is unaffected in the slt2Δ mutant. Wild-type (WLY176), atg1Δ (WLY192), and slt2Δ (KDM1401) cells were cultured as in A, but the time of incubation in SD-N was reduced to 2 h. The Pho8Δ60 assay was performed as described in Materials and methods. Error bars, SD were obtained from three independent repeats. (F) The Cvt pathway is unaffected in the slt2Δ mutant. Wild-type (SEY6210), atg1Δ (WHY001), and slt2Δ (KDM1213) cells were cultured in YPD to mid-log phase, then shifted to SD-N and incubated for 1 h. Samples were taken before and after nitrogen starvation. Immunoblotting was done with anti-Ape1 antibody and the positions of precursor Ape1 and mature Ape1 are indicated. (G) Pex14-GFP processing is blocked in the slt2Δ mutant. PEX14 was chromosomally tagged with GFP in wild-type (TKYM67), atg1Δ (TKYM72), and slt2Δ (KDM1101) strains. Cells were grown in oleic acid–containing medium for 19 h and shifted to SD-N for 4 h. Samples were taken before and after nitrogen starvation. Immunoblotting was done with anti-YFP antibody and the positions of full-length Pex14-GFP and free GFP are indicated. Anti-Pgk1 was used as a loading control.
Figure 2.
Figure 2.
Hog1 is involved in mitophagy, but not other types of autophagy. (A) Om45-GFP processing is blocked in pbs2Δ and hog1Δ mutants. Om45-GFP processing was tested in wild-type (TKYM22), atg32Δ (TKYM130), pbs2Δ (KDM1309), and hog1Δ (KDM1307) cells with the methods described in Fig. 1 B. (B) MitoPho8Δ60 activity is reduced in hog1Δ and pbs2Δ mutants. The mitoPho8Δ60 activity was examined in wild-type (KWY20), atg32Δ (KWY22), pbs2Δ (KDM1005), and hog1Δ (KDM1015) cells as in Fig. 1 D. Error bars, SD were obtained from three independent repeats. (C) The Pho8Δ60 activity is unaffected in the hog1Δ mutant. The Pho8Δ60 assay was performed in wild-type (WLY176), atg1Δ (WLY192), and hog1Δ (KDM1403) cells as in Fig. 1 E. Error bars, SD were obtained from three independent repeats. (D) The Cvt pathway is unaffected in the hog1Δ mutant. Maturation of prApe1 was examined in wild-type (SEY6210), hog1Δ (KDM1214), and atg1Δ (WHY001) cells as in Fig. 1 F. (E) Pex14-GFP processing is unaffected in the hog1Δ mutant. Pex14-GFP processing was examined in wild-type (TKYM67), hog1Δ (KDM1102), and atg1Δ (TKYM72) cells as in Fig. 1 G.
Figure 3.
Figure 3.
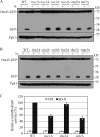
Wsc1 and Ssk1 are required for mitophagy. (A) Om45-GFP processing is blocked in wsc1Δ cells but not other mutants lacking cell surface sensors. Om45-GFP processing was tested in wild-type (KDM2023), wsc1Δ (KDM2024), wsc2Δ (KDM2025), wsc3Δ (KDM2026), wsc4Δ (KDM2027), mid2Δ (KDM2028), and mtl1Δ (KDM2029) cells as in Fig. 1 B. Protein extracts were probed with anti-YFP antibodies and anti-Pgk1 as a loading control. (B) Om45-GFP processing remains normal in rlm1Δ (KDM2030), swi4Δ (KDM2031), swi6Δ (KDM2032), sko1Δ (KDM2033), hot1Δ (KDM2035), and smp1Δ (KDM2034) mutants. Protein extracts were probed as in A. (C) The mitoPho8Δ60 activity is reduced in wsc1Δ (KDM1023) and ssk1Δ (KDM1021) mutants but not in the sho1Δ (KDM1022) mutant. Error bars, SD were obtained from three independent repeats.
Figure 4.
Figure 4.
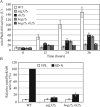
Mitophagy in post-log phase requires Slt2 and Hog1 signaling. (A) MitoPho8Δ60 activity is reduced in slt2Δ, hog1Δ, and hog1Δ slt2Δ mutants in post-log phase mitophagy. Wild-type (KWY20), atg32Δ (KWY22), slt2Δ (KDM1008), hog1Δ (KDM1015), and hog1Δ slt2Δ (KDM1025) cells were cultured in lactate medium to log phase and the cells were grown for another 12, 24, and 36 h. Samples were collected at each time point. The mitoPho8Δ60 assay was performed as described in Materials and methods. Error bars, SD were obtained from three independent repeats. (B) MitoPho8Δ60 activity is reduced in the hog1Δ slt2Δ double mutant in nitrogen starvation–induced mitophagy conditions. The mitoPho8Δ60 assay was performed in wild-type (KWY20), atg32Δ (KWY22), and hog1Δ slt2Δ (KDM1025) cells as in Fig. 1 E.
Figure 5.
Figure 5.
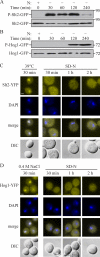
Hog1 and Slt2 are activated and remain in the cytosol during mitophagy. (A and B) SLT2 or HOG1 were chromosomally tagged with GFP. SLT2-GFP (KDM1218) or HOG1-GFP (KDM1217) cells were cultured in YPL to mid-log phase and shifted to SD-N for the indicated times. Samples were taken before (+) and at the indicated times after (−) nitrogen starvation. Immunoblotting was done with anti–phospho-Slt2 antibody in A, anti-phospho-Hog1 antibody in B, or anti-YFP antibody in both A and B. (C and D) Cells (SEY6210) transformed with plasmids encoding either Hog1-YFP or Slt2-YFP were cultured in SML to mid-log phase and shifted to SD-N for the indicated times, or cultured at 39°C for Slt2-YFP in C or treated with 0.4 M NaCl for Hog1-YFP in D. Samples were taken after each specific treatment, fixed, stained with DAPI to mark the nucleus, and observed by fluorescence microscopy. Representative pictures from single Z-section images are shown. DIC, differential interference contrast. Bars, 2.5 µm.
Figure 6.
Figure 6.
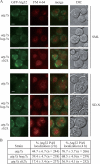
Recruitment of Atg32 to the PAS is defective in the slt2Δ, but not the hog1Δ mutant. (A) Plasmid-driven GFP-Atg32 was transformed into atg1Δ (WHY001), atg1Δ slt2Δ (KDM1203), and atg1Δ hog1Δ (KDM1211) strains. Cells were grown to mid-log phase in SML, shifted to SD-N for 2 or 4 h, and stained with FM 4-64 to mark the vacuole. Representative pictures from single Z-section images are shown. DIC, differential interference contrast. Bars, 2.5 µm. (B) Quantification of Atg32 PAS localization. 12 Z-section images were projected and the percentage of cells that contained at least one GFP-Atg32 dot on the surface of the vacuole was determined. The SD was calculated from three independent experiments.
Figure 7.
Figure 7.
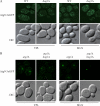
Atg9 movement is unaffected in the hog1Δ mutant. (A and B) The localization of Atg9-3xGFP was tested in wild-type (JGY134) and hog1Δ (KDM1207) strains (A) and atg1Δ (JGY135) and atg1Δ hog1Δ (KDM1212) strains (B). Cells were cultured in growing (YPL medium) conditions and shifted to nitrogen starvation medium (SD-N) for 2 h. Cells were fixed and observed by fluorescence microscopy. Representative pictures from single Z-section images are shown. DIC, differential interference contrast. Bars, 2.5 µm.
Figure 8.
Figure 8.
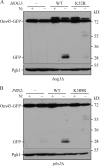
Kinase-dead mutants of Hog1 and Pbs2 have defects in mitophagy. (A) The hog1Δ (KDM1307) or (B) pbs2Δ (KDM1309) cells were transformed with empty vector or a plasmid encoding either (A) wild-type (WT) Hog1 or a kinase-dead mutant (K52R), or (B) with empty vector or a plasmid encoding either wild-type Pbs2 or a kinase-dead mutant (K389R). (A and B) Om45-GFP processing was examined as described in Materials and methods.

Similar articles

Cited by

References

    1. Abeliovich H., Zhang C., Dunn W.A., Jr, Shokat K.M., Klionsky D.J. 2003. Chemical genetic analysis of Apg1 reveals a non-kinase role in the induction of autophagy. Mol. Biol. Cell. 14:477–490 10.1091/mbc.E02-07-0413 - DOI - PMC - PubMed
    1. Alonso-Monge R., Carvaihlo S., Nombela C., Rial E., Pla J. 2009. The Hog1 MAP kinase controls respiratory metabolism in the fungal pathogen Candida albicans. Microbiology. 155:413–423 10.1099/mic.0.023309-0 - DOI - PubMed
    1. Baba M., Osumi M., Scott S.V., Klionsky D.J., Ohsumi Y. 1997. Two distinct pathways for _targeting proteins from the cytoplasm to the vacuole/lysosome. J. Cell Biol. 139:1687–1695 10.1083/jcb.139.7.1687 - DOI - PMC - PubMed
    1. Babour A., Bicknell A.A., Tourtellotte J., Niwa M. 2010. A surveillance pathway monitors the fitness of the endoplasmic reticulum to control its inheritance. Cell. 142:256–269 10.1016/j.cell.2010.06.006 - DOI - PMC - PubMed
    1. Bicknell A.A., Tourtellotte J., Niwa M. 2010. Late phase of the endoplasmic reticulum stress response pathway is regulated by Hog1 MAP kinase. J. Biol. Chem. 285:17545–17555 10.1074/jbc.M109.084681 - DOI - PMC - PubMed

Publication types

MeSH terms

Substances

  NODES
Project 1
twitter 2