. 2011 Jun 14;19(6):728-39.
doi: 10.1016/j.ccr.2011.05.011.

Pancreatitis-induced inflammation contributes to pancreatic cancer by inhibiting oncogene-induced senescence

Affiliations

Pancreatitis-induced inflammation contributes to pancreatic cancer by inhibiting oncogene-induced senescence

Carmen Guerra et al. Cancer Cell. .

Abstract

Pancreatic acinar cells of adult mice (≥P60) are resistant to transformation by some of the most robust oncogenic insults including expression of K-Ras oncogenes and loss of p16Ink4a/p19Arf or Trp53 tumor suppressors. Yet, these acinar cells yield pancreatic intraepithelial neoplasias (mPanIN) and ductal adenocarcinomas (mPDAC) if exposed to limited bouts of non-acute pancreatitis, providing they harbor K-Ras oncogenes. Pancreatitis contributes to tumor progression by abrogating the senescence barrier characteristic of low-grade mPanINs. Attenuation of pancreatitis-induced inflammation also accelerates tissue repair and thwarts mPanIN expansion. Patients with chronic pancreatitis display senescent PanINs, providing they have received antiinflammatory drugs. These results support the concept that antiinflammatory treatment of people diagnosed with pancreatitis may reduce their risk of developing PDAC.


Figures

Figure 1
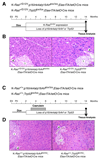
Figure 1. Loss of p16Ink4a/p19Arf or Trp53 tumor suppressors only contribute to mPanIN and mPDAC development in the presence of K-Ras oncogenes and pancreatitis.
(A) K-Ras+/G12V;p16Ink4a/p19Arf/lox/lox;Elas-tTA/tetO-Cre and K-Ras+/G12V;Trp53lox/lox;Elas-tTA/tetO-Cre mice were exposed to doxycycline (Dox, thin line) until P60 to allow expression of the K-RasG12V oncogene and to ablate the p16Ink4a/p19Arf and the Trp53 tumor suppressors in adult acinar cells. (B) H&E staining of paraffin sections obtained from (left) K-Ras+/G12V;p16Ink4a/p19Arflox/lox;Elas-tTA/tetO-Cre mice and (right) K-Ras+/G12V;Trp53lox/lox;Elas-tTA/tetO-Cre mice shows normal parenchyma with no mPanIN lesions one year after turning on K-RasG12V expression and ablating the p16Ink4a/p19Arf and the Trp53 tumor suppressors. Scale bar represents 50 μm. (C) K-Ras+/+;p16Ink4a/p19Arflox/lox;Elas-tTA/tetO-Cre and K-Ras+/+;Trp53lox/lox;Elas-tTA/tetO-Cre mice were exposed to doxycycline (Dox, thin line) until P60 followed by caerulein treatment for three months (grey box) to ablate the p16Ink4a/p19Arf and the Trp53 tumor suppressors in adult acinar cells. (D) H&E staining of paraffin sections obtained from (left) K-Ras+/+;p16Ink4a/p19Arflox/lox;Elas-tTA/tetO-Cre mice and (right) K-Ras+/+;Trp53lox/lox;Elas-tTA/tetO-Cre mice shows normal parenchyma with no mPanIN lesions 8 months after finishing caerulein treatment. (E) Sections obtained from control K-Ras+/G12V;Elas-tTA/tetO-Cre mice submitted to the same protocol display abundant mPanIN lesions (arrowheads) surrounded by areas of fibrosis with inflammatory infiltrates (asterisk). (i) indicates islets; (d) indicates normal ducts. Scale bar represents 50 μm. See also Figure S1.
Figure 2
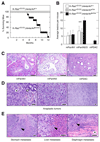
Figure 2. Loss of p16Ink4a/p19Arf tumor suppressors accelerates mPanIN and mPDAC development and induces anaplastic sarcomatoid tumors.
(A) Survival of (solid circles) K-Ras+/G12V;p16Ink4a/p19Arflox/lox;Elas-tTA/tetO-Cre and (open circles) K-Ras+/G12V;p16Ink4a/p19Arf+/+;Elas-tTA/tetO-Cre mice exposed to doxycycline until P60 to activate the mutations during adulthood and subsequently treated with caerulein. (B) Average number of mPanINl, mPanIN2/3 and mPDAC lesions displayed at 6 months of age by (solid bars) K-Ras+/G12V;p16Ink4a/p19Arflox/lox;Elas-tTA/tetO-Cre (n=5), (grey bars) K-Ras+/G12V;p16Ink4a/p19Arf+/lox;Elas-tTA/tetO-Cre (n=4) and (open bars) K-Ras+/G12V;p16Ink4a/p19Arf+/+;Elas-tTA/tetO-Cre (n=5) mice exposed to doxycycline until P60 to activate the mutations during adulthood and subsequently treated with caerulein. Data shown represent mean ± SD. **p < 0.01. (C) H&E stained paraffin sections depicting representative (left) low-grade mPanINl, (middle) high-grade mPanIN3 and (right) mPDAC lesions observed in the K-Ras+/G12V;p16Ink4a/p19Arflox/lox;Elas-tTA/tetO-Cre mice described in (B). The scale bars represent (left and centre) 20 μm and (right) 50μm. (D) H&E staining of anaplastic tumors displayed by K-Ras+/G12V;p16Ink4a/p19Arflox/lox;Elas-tTA/tetO-Cre mice not exposed to doxycycline that underwent K-RasG12V expression and loss of p16Ink4a/p19Arf tumor suppressors in acinar cells during embryonic development. (Left) Anaplastic tumor with scarce glandular component. Anaplastic (asterisk) and glandular (arrowhead) areas are indicated. (Center) Anaplastic carcinoma with large, bizarre cells lying in a loose, mixoid stroma. (Right) Panoramic view of an anaplastic carcinoma. Note the absence of ductular structures. Mice were sacrificed at humane end point (15-20 weeks of age). (E) H&E staining of metastasis displayed by the K-Ras+/G12V;p16Ink4a/p19Arflox/lox;Elas-tTA/tetO-Cre mice described in (D). (Left) Stomach tissue. Tumoral cells are infiltrating the muscular layer between forestomach and glandular stomach (arrowhead). (Center) Undifferentiated cells metastasizing to the liver (arrowheads). (Right) Metastasis to the diaphragm (arrowhead). Some eosinophilic muscular fascicles can be recognized (asterisk). Mice were sacrificed at humane end point (15-20 weeks of age). The scale bar represents 50 μm. See also Figure S2.
Figure 3
Figure 3. Episodic pancreatitis induces mPanINs and mPDAC in K-Ras+/G12V;Elas-tTA/tetO-Cre mice.
K-Ras+/G12V;Elas-tTA/tetO-Cre mice were exposed to doxycycline (thin line) and caerulein (grey box) for the indicated periods of time. The open box indicates the time of K-RasG12V expression. The number of animals positive for low-grade mPanINl, high-grade mPanIN2/3 and mPDAC is indicated for each protocol and time point. (A) Mice exposed to doxycycline (Dox) from conception (E0) to P60 were treated with caerulein (Caerul) for three months, from P90 to P180. Mice were sacrificed at 8 and 14 months of age, that is 6 and 12 months after turning on K-RasG12V expression. (B) Mice exposed to doxycycline from conception (E0) to P60 were treated with caerulein for one month, from P90 to P120. Mice were sacrificed at 8 and 14 months of age, that is 6 and 12 months after turning on K-RasG12V expression. (C) Mice exposed to doxycycline from conception (E0) to P150 were treated with caerulein for three months, from P30 to P120. Mice were sacrificed at 11, 17 and 23 months of age, that is, 6, 12 and 18 months after turning on K-RasG12V expression. See also Figure S3.
Figure 4
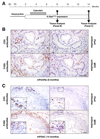
Figure 4. Inflammatory infiltrates in mPanIN lesions and mPDAC in K-RasG12V expressing adult mice treated with caerulein for three months.
(A) K-Ras+/G12V;Elas-tTA/tetO-Cre mice were exposed to doxycycline (thin line) and caerulein (grey box) for the indicated periods of time. Expression of the K-RasG12V oncogene (open box) is indicated. Mice were sacrificed at 8 and 14 month of age. (B,C) Immunostaining of inflammatory cells surrounding (B) mPanIN lesions in 8 month old mice (2 months after cessation of caerulein) and (C) mPDAC in 14 month old mice (8 months after cessation of caerulein treatment) using antibodies against T lymphocytes (CD3 antibodies), B lymphocytes (Pax5 antibodies), macrophages (F4/80 antibodies) and neutrophils (MPO antibodies). Insets show detailed areas containing the corresponding immune cells. Scale bars represent 50 μm.
Figure 5
Figure 5. Senescence markers are a feature of low-grade mPanINs, but disappear in high-grade mPanIN2/3 and mPDAC.
(A-C) Senescence associated β-galactosidase (SA-β-Gal) staining (blue) in (A) low-grade mPanIN1 but not in (B) high-grade mPanIN2/3 or (C) mPDAC. (D-F) p16Ink4a immunostaining (brown) in (D) low-grade mPanIN1 but not in (E) high-grade mPanIN2/3 or (F) mPDAC. (G-I) Ki67 immunostaining (brown) inversely correlates with the expression of the above senescence markers. Ki67 is detected in a low percentage of cells of low-grade mPanIN1 (G) and in a high percentage of cells of high-grade mPanIN2/3 (H) and mPDAC (I). Note that panels D-G, E-H and F-I correspond to serial sections. Scale bar represents 50 μm. See also Figure S4.
Figure 6
Figure 6. Senescent low-grade mPanINs reappear upon partial recovery from pancreatitis injury.
(LEFT) K-Ras+/G12V;Elas-tTA/tetO-Cre mice not exposed to doxycycline, thus expressing the endogenous K-RasG12V oncogene since embryonic development (E16.5). (A-C) Pancreatic sections showing low-grade mPanIN1 lesions. Sections were stained for (A,B) SA-β-Gal (blue) or (C) p16Ink4a (brown) expression. Panel B is an amplified version of panel A to better illustrate SA-β-Gal expression in mPanIN1 lesions. (D-F) Pancreatic sections of mice treated with caerulein for three months (P60 to P150) depicting low-grade mPanIN1 lesions. Sections were stained for (D,E) SA-β-Gal (blue) or (F) p16Ink4a (brown) expression. Panel E is an amplified version of panel D to better illustrate the absence of SA-β-Gal expression in mPanIN1 lesions. (RIGHT) K-Ras+/G12V;Elas-tTA/tetO-Cre mice exposed to doxycycline from conception to P60, thus expressing the endogenous K-RasG12V oncogene since P60. (G-I) Pancreatic sections of mice treated with caerulein for three months (P90 to P180) showing low-grade mPanIN1 lesions. Sections were stained for (G,H) SA-β-Gal (blue) and (I) p16Ink4a (brown) expression. Panel H is an amplified version of panel G to better illustrate the absence of SA-β-Gal expression in mPanIN1 lesions. (J-L) Pancreatic sections of mice treated with caerulein for three months (P90 to P180) and allowed to recover for three additional months showing low-grade mPanIN1 lesions. Sections were stained for (J,K) SA-β-Gal (blue) and (L) p16Ink4a (brown) expression. Panel K is an amplified version of panel J to better illustrate the reappearance of SA-β-Gal expression in mPanINl lesions. Scale bars represent 50 μm (A, D, G, J) and 20 μm (B,C,E,F,H,I,K,L). See also Figure S5.
Figure 7
Figure 7. Inhibition of the inflammatory response by Sulindac reverts tissue damage and delays progression of mPanIN lesions.
K-Ras+/G12V;Elas-tTA/tetO-Cre mice, exposed to doxycycline until P60 to achieve expression of K-RasG12V in the adult pancreas were treated with caerulein for three months (P90-P180). Half the mice were allowed to recover for three months without further treatment whereas the other half was treated with Sulindac. (A) H&E-stained paraffin sections of representative pancreata of mice (Left) not treated or (Right) treated with Sulindac. Note that the pancreata of the untreated mice displayed high levels of edema, fibrosis, parenchyma atrophy and abundant large mPanIN lesions. In contrast, mice that underwent Sulindac treatment showed a well-preserved parenchyma and contained few small mPanINs. Arrowheads point to mPanIN lesions, (i) indicates an islet. Scale bar represents 50 μm. (B) Average lesions per mouse. Solid bars indicate mice not treated with Sulindac (n=3). Open bars correspond to mice treated with Sulindac (n=3). Data shown represent mean ± SD. ***p < 0.00017, *p < 0.036. (C) Area of mPanIN1, mPanIN2/3 and mPDAC lesions observed in serial pancreata sections. Solid bars indicate mice not treated with Sulindac (n=3). Open bars correspond to mice treated with Sulindac (n=3). Data shown represent mean ± SD. **p < 0.0037, ***p < 0.00012. See also Figure S6.
Figure 8
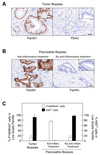
Figure 8. Senescence markers in human low-grade PanINs.
(A) Low-grade PanINs present in biopsies from PDAC patients display senescence markers. (Left) Sections showing low-grade PanIN1s are positive for P16INK4a immunostaining. (Right) Sections depicting PDAC lesions are negative for P16INK4a immunostaining. Insets show amplified images to illustrate nuclear staining in PanIN1 lesions. Scale bar represents 50 μm. (B,C) Anti-inflammatory treatment restores senescence in low-grade PanIN of chronic pancreatitis patients. (B) P16INK4a immunostaining of biopsies obtained from patients suffering from chronic pancreatitis. (Left) Representative section displaying low-grade PanIN1s positive for P16INK4a staining present in a biopsy obtained from a patient treated with anti-inflammatory drugs. (Right) Representative section displaying low-grade PanIN1s negative for P16INK4a staining present in a biopsy obtained from a patient not-treated with anti-inflammatory drugs. Insets show amplified images to illustrate nuclear staining in PanIN1 lesions. Scale bar represents 50 μm. (C) Quantification of the percentage of cells present in low-grade PanIN1 lesions positive for (open bars) P16INK4a immunostaining or (solid bars) Ki67 staining. Samples were obtained from (left) PDAC patients, (center) chronic pancreatitis patients treated with anti-inflammatory drugs and (right) chronic pancreatitis patients not treated with anti-inflammatory drugs. See also Figure S7 and Table S1.

Similar articles

Cited by

References

    1. Aguirre AJ, Bardeesy N, Sinha M, Lopez L, Tuveson DA, Horner J, Redston MS, DePinho RA. Activated Kras and Ink4a/Arf deficiency cooperate to produce metastatic pancreatic ductal adenocarcinoma. Genes Dev. 2003;17:3112–3126. - PMC - PubMed
    1. Bardeesy N, Cheng KH, Berger JH, Chu GC, Pahler J, Olson P, Hezel AF, Horner J, Lauwers GY, Hanahan D, DePinho RA. Smad4 is dispensable for normal pancreas development yet critical in progression and tumor biology of pancreas cancer. Genes Dev. 2006;20:3130–3146. - PMC - PubMed
    1. Bonifazi M, Gallus S, Bosetti C, Polesel J, Serraino D, Talamini R, Negri E, La Vecchia C. Aspirin use and pancreatic cancer risk. Eur J Cancer Prev. 2010;19:352–354. - PubMed
    1. Bradley MC, Hughes CM, Cantwell MM, Napolitano G, Murray LJ. Nonsteroidal anti-inflammatory drugs and pancreatic cancer risk: a nested case – control study. British Journal of Cancer. 2010;102:1415–1421. - PMC - PubMed
    1. Collado M, Gil J, Efeyan A, Guerra C, Schuhmacher AJ, Barradas M, Benguría A, Zaballos A, Flores JM, Barbacid M, Beach D, et al. Tumour biology: senescence inpremalignant tumours. Nature. 2005;436:642. - PubMed

Publication types

MeSH terms

Substances

  NODES
INTERN 2
Note 3
twitter 2