. 2011 Aug 5;286(31):27781-91.
doi: 10.1074/jbc.M111.255331. Epub 2011 Jun 16.

Transport activity of the high-affinity monocarboxylate transporter MCT2 is enhanced by extracellular carbonic anhydrase IV but not by intracellular carbonic anhydrase II

Affiliations

Transport activity of the high-affinity monocarboxylate transporter MCT2 is enhanced by extracellular carbonic anhydrase IV but not by intracellular carbonic anhydrase II

Michael Klier et al. J Biol Chem. .

Abstract

The ubiquitous enzyme carbonic anhydrase isoform II (CAII) has been shown to enhance transport activity of the proton-coupled monocarboxylate transporters MCT1 and MCT4 in a non-catalytic manner. In this study, we investigated the role of cytosolic CAII and of the extracellular, membrane-bound CA isoform IV (CAIV) on the lactate transport activity of the high-affinity monocarboxylate transporter MCT2, heterologously expressed in Xenopus oocytes. In contrast to MCT1 and MCT4, transport activity of MCT2 was not altered by CAII. However, coexpression of CAIV with MCT2 resulted in a significant increase in MCT2 transport activity when the transporter was coexpressed with its associated ancillary protein GP70 (embigin). The CAIV-mediated augmentation of MCT2 activity was independent of the catalytic activity of the enzyme, as application of the CA-inhibitor ethoxyzolamide or coexpressing the catalytically inactive mutant CAIV-V165Y did not suppress CAIV-mediated augmentation of MCT2 transport activity. Furthermore, exchange of His-88, mediating an intramolecular H(+)-shuttle in CAIV, to alanine resulted only in a slight decrease in CAIV-mediated augmentation of MCT2 activity. The data suggest that extracellular membrane-bound CAIV, but not cytosolic CAII, augments transport activity of MCT2 in a non-catalytic manner, possibly by facilitating a proton pathway other than His-88.


Figures
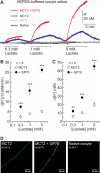
FIGURE 1.
FIGURE 1.
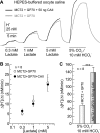
MCT2 needs GP70 for robust expression and function in Xenopus oocytes. A, original recordings of [H+]i concentration in Xenopus oocytes either expressing MCT2 alone (blue trace), MCT2+GP70 (red trace), GP70 alone (gray trace), or native oocytes (black trace) during application of 0.3, 1, and 5 mm lactate. Rate of change (B) and amplitude (C) in [H+]i induced by application of lactate in oocytes expressing MCT2 (○) and MCT2+GP70 (●), respectively. The asterisks at the circles for MCT2+GP70-coexpressing oocytes refer to the values of MCT2-expressing cells. D, fluorescence staining of MCT2 in slices of oocytes expressing MCT2 alone (left panel) and MCT2+GP70 (middle panel), respectively. Native oocytes were stained against MCT2 as control (right panel). A significance level of p < 0.01 is marked with **, and p < 0.001 with ***.
FIGURE 2.
FIGURE 2.
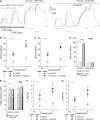
CAII does not enhance activity of MCT2. A, original recordings of [H+]i in MCT2+GP70-coexpressing Xenopus oocytes either injected with 50 ng of CAII protein (black trace) or 27.6 nl of H2O as control (gray trace) during application of 0.3, 1, and 5 mm lactate and 5% CO2/10 mm HCO3. Shown is the rate of change in [H+]i in MCT2+GP70-coexpressing oocytes injected with 50 ng CAII or water, as induced by application of lactate (B) and CO2/ HCO3 (C), respectively. A significance level of p < 0.001 is marked with ***.
FIGURE 3.
FIGURE 3.
Transport activity of MCT2 is enhanced by CAIV. A, original recordings of [H+]i in Xenopus oocytes, either coexpressing MCT2+GP70 (gray trace) or MCT2+GP70+CAIV (black trace) during application of 1 and 5 mm lactate, in the absence and presence 2% CO2/4 mm HCO3 (at constant pHe of 7.0), before and during application of 10 μm EZA. Shown is the rate of change in [H+]i in oocytes coexpressing MCT2+GP70 (○ and □) and MCT2+GP70+CAIV (● and ■), respectively, as induced by application of lactate in the absence (B) and presence (C) of CO2/ HCO3 and by application of CO2/ HCO3 itself (D) before (○ and ●) and during application of EZA (□ and ■). E, intrinsic (βi) and CO2/ HCO3-dependent (βCO2) buffer capacity in oocytes coexpressing MCT2+GP70 and MCT2+GP70+CAIV, and in the absence and presence of EZA, respectively. Shown also is the lactate-induced acid/base flux in oocytes coexpressing MCT2+GP70 (○ and □) and MCT2+GP70+CAIV (□ and ■), respectively, in the absence (F) and presence (G) of CO2/ HCO3, with (□ and ■) and without EZA (○ and ●). The asterisks at the symbols for MCT2+GP70+CAIV-coexpressing oocytes refer to the values of MCT2+GP70-coexpressing cells. A significance level of p < 0.01 is marked with **, and p < 0.001 with ***.
FIGURE 4.
FIGURE 4.
Activity of MCT2 is also enhanced by the catalytically inactive mutant CAIV-V165Y and by CAIV-H88A, a mutant with impaired H+ shuttle. Rate of rise in [H+]i, as induced by application of 0.3, 1, and 5 mm lactate (A) and 5% CO2/10 mm HCO3 (B) in oocytes coexpressing MCT2+GP70 (● in A), MCT2+GP70+CAIV-WT (□ in A), MCT2+GP70+CAIV-V165Y (△ in A), and MCT2+GP70+CAIV-H88A (▿ in A), respectively. A significance level of p < 0.05 is marked with *, p < 0.01 with **, and p < 0.001 with ***.
FIGURE 5.
FIGURE 5.
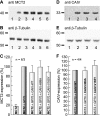
Expression levels of MCT2 are increased by coexpression with GP70 but not by coexpression with CAIV. Western blot analysis for MCT2 (A) and CAIV (D), respectively, and β-tubulin (B and E) as loading control from native oocytes (A1 and D1) and oocytes expressing MCT2 (A2), MCT2+GP70 (A3), MCT2+GP70+CAIV-WT (A4 and D2), MCT2+GP70+CAIV-H88A (A5 and D3), and MCT2+GP70+CAIV-V165Y (A6 and D4). Quantification of the relative expression levels of MCT2 (C) and CAIV (F), respectively, by Western blot analyses. The n value is given as blots/badges of oocytes. The expression level of MCT2 in non-GP70-expressing oocytes is significantly lower (p ≤ 0.001) as compared with GP70-expressing cells, which do not differ significantly from each other. The expression levels of CAIV mutants do not differ from CAIV-WT.
FIGURE 6.
FIGURE 6.
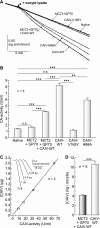
Determination of CA catalytic activity of via mass spectrometry. A, original recordings of the log enrichment of 20 native oocytes and 20 oocytes expressing either MCT2+GP70, MCT2+GP70+CAIV-WT, CAIV-WT, CAIV-H88A, or CAIV-V165Y, respectively. The beginning of the traces shows the rate of degradation of the 18O-labeled substrate in the non-catalyzed reaction. The black arrowhead indicates the addition of the oocytes. B, enzymatic activity in units/ml at pH 7.0. One unit is defined as 100% stimulation of the non-catalyzed 18O depletion of doubly labeled 13C18O2. The asterisks above the bars refer to the values of native cells. C, calibration curve for the determination of the active CAIV concentration in the oocytes by measuring the activity of different amounts of CAIV protein (0.25, 0.5, 1, and 2 μg) and fitted by linear regression to calculate the amount of expressed CAIV. The inset shows the original recordings of the log enrichment for the four amounts of purified CAIV. D, amount of CAIV in ng/oocyte in oocytes expressing CAIV-WT alone and in oocytes coexpressing MCT2+GP70+CAIV-WT. A significance level of p < 0.01 is marked with **, and p < 0.001 with ***.
FIGURE 7.
FIGURE 7.
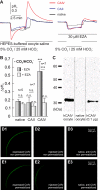
Heterologously expressed CAIV is located at the extracellular surface of the Xenopus oocyte. A, original recordings of pHs at the outer surface of native (black trace), CAII-expressing (blue trace), and CAIV-expressing (red trace) oocytes during application of 5% CO2/25 mm HCO3, in the absence and presence of 30 μm EZA. B, amplitude of the pHs-transient of native, CAII-expressing, and CAIV-expressing oocytes, as induced by withdrawal of 5% CO2/25 mm HCO3, in the absence and presence of 30 μm EZA. C, Western blot analysis for CAIV from biotinylated native or CAIV-expressing oocytes and of 0.1 μg CAIV protein. Antibody staining against CAIV in oocytes either expressing CAIV (D1 and E1), injected with CAIV protein (D2 and E2), and native oocytes (D3 and E3), respectively, which were either permeabilized with methanol (E1–3) or left non-permeabilized (D1–3). A significance level of p < 0.001 is marked with ***.
FIGURE 8.
FIGURE 8.
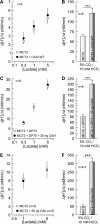
Rate of rise in [H+]i as induced by application of 0. 3, 1, and 5 mm lactate (A, C, and E) and 5% CO2/10 mm HCO3 (B, D, and F) in oocytes expressing MCT2 or MCT2+CAIV (A and B), in MCT2+GP70-coexpressing oocytes either injected with 35 ng CAIV protein or H2O as control (C and D), and in MCT2-expressing oocytes either injected with 50 ng CAII protein or H2O as control (E and F). A significance level of p < 0.001 is marked with ***.
FIGURE 9.
FIGURE 9.
Hypothetical model of the interaction between MCT2 and CAIV. CAIV (red circle), anchored to the extracellular side of the plasma membrane by GPI (dark blue structure) is located close to the MCT2 (yellow structure) by direct interaction with GP70 (green). In this position, CAIV can apply its intramolecular H+ shuttle to supply H+ to the MCT2. In contrast, CAII (orange circle) does not interact with MCT2, possibly because of a lack of a CAII-binding site in the C-terminal of MCT2, which prevents CAII from getting close enough to the transporter to establish an efficient H+ shuttle.

Similar articles

Cited by

References

    1. Halestrap A. P., Meredith D. (2004) Pflügers Arch. 447, 619–628 - PubMed
    1. Bröer S., Bröer A., Schneider H. P., Stegen C., Halestrap A. P., Deitmer J. W. (1999) Biochem. J. 341, 529–535 - PMC - PubMed
    1. Garcia C. K., Brown M. S., Pathak R. K., Goldstein J. L. (1995) J. Biol. Chem. 270, 1843–1849 - PubMed
    1. Jackson V. N., Price N. T., Carpenter L., Halestrap A. P. (1997) Biochem. J. 324, 447–453 - PMC - PubMed
    1. Halestrap A. P., Price N. T. (1999) Biochem. J. 343, 281–299 - PMC - PubMed

Publication types

LinkOut - more resources

  NODES
twitter 2