NRF2 activation restores disease related metabolic deficiencies in olfactory neurosphere-derived cells from patients with sporadic Parkinson's disease
- PMID: 21747966
- PMCID: PMC3128624
- DOI: 10.1371/journal.pone.0021907
NRF2 activation restores disease related metabolic deficiencies in olfactory neurosphere-derived cells from patients with sporadic Parkinson's disease
Abstract
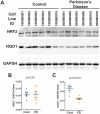
Background: Without appropriate cellular models the etiology of idiopathic Parkinson's disease remains unknown. We recently reported a novel patient-derived cellular model generated from biopsies of the olfactory mucosa (termed olfactory neurosphere-derived (hONS) cells) which express functional and genetic differences in a disease-specific manner. Transcriptomic analysis of Patient and Control hONS cells identified the NRF2 transcription factor signalling pathway as the most differentially expressed in Parkinson's disease.
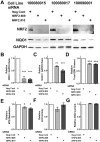
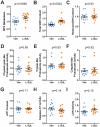
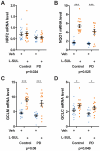
Results: We tested the robustness of our initial findings by including additional cell lines and confirmed that hONS cells from Patients had 20% reductions in reduced glutathione levels and MTS [3-(4,5-dimethylthiazol-2-yl)-5-(3-carboxymethoxyphenyl)-2-(4-sulfophenyl)-2H-tetrazolium, inner salt] metabolism compared to cultures from healthy Control donors. We also confirmed that Patient hONS cells are in a state of oxidative stress due to higher production of H(2)O(2) than Control cultures. siRNA-mediated ablation of NRF2 in Control donor cells decreased both total glutathione content and MTS metabolism to levels detected in cells from Parkinson's Disease patients. Conversely, and more importantly, we showed that activation of the NRF2 pathway in Parkinson's disease hONS cultures restored glutathione levels and MTS metabolism to Control levels. Paradoxically, transcriptomic analysis after NRF2 pathway activation revealed an increased number of differentially expressed mRNAs within the NRF2 pathway in L-SUL treated Patient-derived hONS cells compared to L-SUL treated Controls, even though their metabolism was restored to normal. We also identified differential expression of the PI3K/AKT signalling pathway, but only post-treatment.
Conclusions: Our results confirmed NRF2 as a potential therapeutic _target for Parkinson's disease and provided the first demonstration that NRF2 function was inducible in Patient-derived cells from donors with uniquely varied genetic backgrounds. However, our results also demonstrated that the response of PD patient-derived cells was not co-ordinated in the same way as in Control cells. This may be an important factor when developing new therapeutics.
Conflict of interest statement
Figures

Similar articles
-
Rotenone Susceptibility Phenotype in Olfactory Derived Patient Cells as a Model of Idiopathic Parkinson's Disease.PLoS One. 2016 Apr 28;11(4):e0154544. doi: 10.1371/journal.pone.0154544. eCollection 2016. PLoS One. 2016. PMID: 27123847 Free PMC article.
-
Comprehensive assessment of genetic sequence variants in the antioxidant 'master regulator' NRF2 in idiopathic Parkinson's disease.PLoS One. 2015 May 26;10(5):e0128030. doi: 10.1371/journal.pone.0128030. eCollection 2015. PLoS One. 2015. PMID: 26010367 Free PMC article.
-
Systemic activation of Nrf2 pathway in Parkinson's disease.Mov Disord. 2020 Jan;35(1):180-184. doi: 10.1002/mds.27878. Epub 2019 Nov 4. Mov Disord. 2020. PMID: 31682033
-
Crosstalk between Nrf2 signaling and mitochondrial function in Parkinson's disease.Mol Cell Neurosci. 2019 Dec;101:103413. doi: 10.1016/j.mcn.2019.103413. Epub 2019 Oct 20. Mol Cell Neurosci. 2019. PMID: 31644952 Free PMC article. Review.
-
Shaping the Nrf2-ARE-related pathways in Alzheimer's and Parkinson's diseases.Ageing Res Rev. 2019 Sep;54:100942. doi: 10.1016/j.arr.2019.100942. Epub 2019 Aug 12. Ageing Res Rev. 2019. PMID: 31415806 Review.
Cited by
-
A Novel Compound ITC-3 Activates the Nrf2 Signaling and Provides Neuroprotection in Parkinson's Disease Models.Neurotox Res. 2015 Nov;28(4):332-45. doi: 10.1007/s12640-015-9550-z. Epub 2015 Aug 2. Neurotox Res. 2015. PMID: 26233727
-
Responsive Expression of MafF to β-Amyloid-Induced Oxidative Stress.Dis Markers. 2020 Dec 7;2020:8861358. doi: 10.1155/2020/8861358. eCollection 2020. Dis Markers. 2020. PMID: 33488846 Free PMC article.
-
Rotenone Susceptibility Phenotype in Olfactory Derived Patient Cells as a Model of Idiopathic Parkinson's Disease.PLoS One. 2016 Apr 28;11(4):e0154544. doi: 10.1371/journal.pone.0154544. eCollection 2016. PLoS One. 2016. PMID: 27123847 Free PMC article.
-
Activating transcription factor 3 and the nervous system.Front Mol Neurosci. 2012 Feb 14;5:7. doi: 10.3389/fnmol.2012.00007. eCollection 2012. Front Mol Neurosci. 2012. PMID: 22347845 Free PMC article.
-
The multifaceted role of Nrf2 in mitochondrial function.Curr Opin Toxicol. 2016 Dec;1:80-91. doi: 10.1016/j.cotox.2016.10.002. Curr Opin Toxicol. 2016. PMID: 28066829 Free PMC article. Review.
References
-
- Dawson TM, Dawson VL. Molecular pathways of neurodegeneration in Parkinson's disease. Science. 2003;302:819–822. - PubMed
-
- Terzioglu M, Galter D. Parkinson's disease: genetic versus toxin-induced rodent models. Febs J. 2008;275:1384–1391. - PubMed
-
- Thomas B, Beal MF. Parkinson's disease. Hum Mol Genet. 2007;16:R183–194. - PubMed
-
- Haehner A, Boesveldt S, Berendse HW, Mackay-Sim A, Fleischmann J, et al. Prevalence of smell loss in Parkinson's disease--a multicenter study. Parkinsonism Relat Disord. 2009;15:490–494. - PubMed
-
- Feron F, Perry C, McGrath JJ, Mackay-Sim A. New techniques for biopsy and culture of human olfactory epithelial neurons. Arch Otolaryngol Head Neck Surg. 1998;124:861–866. - PubMed
Publication types
MeSH terms
Substances
LinkOut - more resources
Full Text Sources
Medical

