. 2011 Sep 1:3:89-98.
doi: 10.2147/HMER.S12368.

Inhibition of Notch signaling affects hepatic oval cell response in rat model of 2AAF-PH

Affiliations

Inhibition of Notch signaling affects hepatic oval cell response in rat model of 2AAF-PH

Houda Darwiche et al. Hepat Med. .

Abstract

BACKGROUND AND AIMS: Activation of the oval cell compartment occurs in the liver when hepatocytes are functionally compromised and/or unable to divide. Our goal was to investigate the systemic signals responsible for determining the efficiency of oval cell-mediated liver regeneration, focusing on the Notch signaling cascade. METHODS: The established oval cell induction protocol of 2-acetylaminofluorine (2-AAF) implantation followed by 70% surgical resection of the liver (partial hepatectomy, PH) was employed in a rat model. This oval cell induction model was further combined with injections of a γ-secretase inhibitor (GSI XX) to examine the effects of Notch inhibition on oval cell-aided regeneration of the liver. RESULTS: Notch signaling was found to be upregulated at the peak of oval cell induction during 2AAF-PH alone. Treatment with GSI XX led to interruption of the Notch signal, as shown by a decrease in expression of Hes1. While there was a robust oval cell response seen at day 11 post-PH, there was a measurable delay in differentiation when Notch was inhibited. This was confirmed morphologically as well as by immunohistochemistry for the oval cell markers, α-fetoprotein, OV-6, and CK19. The hepatocytes seen at day 22 demonstrated an enhanced hepatocellular mitoinhibition index (p21(Waf1)/Ki67), suggestive of dysregulated proliferation and cell cycle progression. Moreover, these hepatocytes exhibited decreased expression of hepatocyte functional markers, such as cytochrome P450 and glucose-6-phosphatase-α. CONCLUSIONS: Taken together, these results identify the Notch signaling pathway as a potent regulator of differentiation and proliferation in oval cells, which is necessary for functional for repair of the liver by oval cells.


Figures

Figure 1
Figure 1
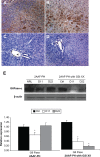
Hepatic oval cell activation and detection of Notch expression. A) Representative hematoxylin and eosin staining of liver section taken from animals on the 2AAF-PH protocol alone on day 11 post-PH. B) Representative hematoxylin and eosin staining of liver section taken from animals on the 2AAF-PH protocol alone on day 22 post-PH. C) Representative hematoxylin and eosin staining of day 11 liver section taken from animals on the 2AAF-PH protocol and treated with GSI XX. D) Representative hematoxylin and eosin staining of day 22 liver section taken from animals on the 2AAF-PH protocol and treated with GSI XX. In A, C, and D, “streaming” oval cells (black arrows) can be seen between portal triads (periportal regions); this phenomenon is absent in B, where the oval cells have differentiated into mature lineages by day 22 post-PH. In C, the white arrow indicates cells part of the immune infiltrate (small, dark, punctate cells), which have mostly disappeared by day 22 (D) because the vehicle/inhibitor have been processed out of the liver. E) Left: Western blot analysis performed on protein isolated from liver taken at day 11 and day 22 post-PH alone with an antibody specific for the NICD, or cleaved (activated) portion of the Notch1 receptor. Right: semiquantitative analysis of Notch1 protein in the 2AAF-PH alone group for control, day 11 post-PH, and day 22 post-PH samples. Expression was normalized to β-actin and significance calculated compared with control animals. *P < 0.01. F) Left: Western blot analysis performed on protein isolated from liver taken at day 11 and day 22 post-2AAF-PH with an antibody specific for NICD, or cleaved (activated) portion of the Notch1 receptor. Right: Semiquantitative analysis of Notch1 protein in control, day 11 post-PH, and day 22 post-2AAF-PH livers from animals treated with GSI XX. Expression was normalized to β-actin and significance calculated compared with control animals. *P < 0.01. A–D 200×. Abbreviations: NICD, Notch intracellular cytoplasmic domain; GSI XX, γ-secretase inhibitor; PH, partial hepatectomy; 2AAF-PH, 2-acetylaminofluorine implantation followed by 70% surgical resection of the liver.
Figure 2
Figure 2
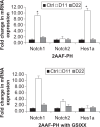
Real-time PCR analysis of Notch pathway genes. A) Quantitative real-time polymerase chain reaction analysis shows an increase in Notch1 gene expression at day 11 post-PH in livers isolated from animals on the 2AAF-PH protocol as compared with controls. Notch1 expression returns to near normal levels by day 22 post-PH. This expression pattern is also seen when 2AAF-PH is combined with GSI XX treatments, B) as the inhibitor _targets the signal at the protein level. A similar expression pattern is seen for downstream effector Hes1, which dramatically increases at day 11 post-PH alone and returns to basal levels by day 22 post-PH alone. Hes1 was found to be significantly downregulated at day 11 post-PH in the GSI XX-treated group as compared with 2AAF-PH alone. Gene expression was normalized to β-actin and significance calculated compared with control animals. *P < 0.01; error bars, SD. Abbreviations: GSI XX, γ-secretase inhibitor; PH, partial hepatectomy; 2AAF-PH, 2-acetylaminofluorine implantation followed by 70% surgical resection of the liver; PCR, polymerase chain reaction; SD, standard deviation.
Figure 3
Figure 3
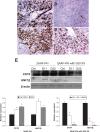
Analysis of oval cell surface marker expression upon Notch inhibition. A–D) Immunohistochemical analysis of OV-6 expression during 2AAF-PH alone (A and B) and in combination with GSI XX treatment (C and D). In the 2AAF-PH group, there is a dramatic increase in OV-6 expression at day 11 post-PH (A), which drops back down by day 22 post-PH (B), because all the oval cells have differentiated into mature phenotypes by this point. In the GSI XX-treated group similar levels of OV-6 expression are seen at day 11 post-PH (C), but a significant amount of staining remains at day 22 post-PH when Notch signaling is inhibited (D). E) Western blot analysis performed on protein isolated from liver taken at day 11 and day 22 post-PH from both treatment groups and probed with an antibody specific for the biliary markers CK19 and HNF-1β. During 2AAF-PH alone, expression of CK19 increases at day 11 post-PH and stays elevated by day 22 post-PH, indicative of biliary differentiation in the regenerated liver. However in the GSI XX-treated group, there is not as significant an increase in CK19 levels at day 11, a difference that is even more pronounced in the day 22 post-PH sample. Similar analysis performed with an antibody specific for HNF-1β shows a stark downregulation of the biliary transcription factor at both days 11 and 22 post-PH in the GSI XX-treated group as compared with 2AAF-PH alone. Bottom: Semiquantitative analysis of CK19 and HNF-1β protein in both treatment groups for control, day 11 post-PH, and day 22 post-PH samples. Expression was normalized to β-actin and significance calculated compared with control animals. Notes: *P <0.01, error bars, SD. Abbreviations: GSI XX, γ-secretase inhibitor; PH, partial hepatectomy; 2AAF-PH, 2-acetylaminofluorine implantation followed by 70% surgical resection of the liver; SD, standard deviation; HNF, hepatocyte nuclear factor.
Figure 4
Figure 4
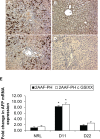
Aberrant AFP expression profiles in the absence of Notch. A–D) Immunohistochemical analysis of AFP expression at days 11 and 22 post-PH during 2AAF-PH alone (A and B) as well as in combination with GSI XX treatment (C and D). As seen with the OV-6 staining in the 2AAF-PH group, there is a dramatic increase in AFP expression at day 11 post-PH (A) which drops back down by day 22 post-PH (B). However, in the GSI XX-treated group, although there is a rise in AFP expression at day 11 (C), there is no apparent AFP staining in the oval cells present at day 22 post-PH (D). E) Quantitative real-time polymerase chain reaction analysis for AFP mRNA expression at days 11 and 22 in livers from animals treated with 2AAF-PH alone or 2AAF-PH combined with GSI XX. mRNA expression follows a similar pattern to the protein expression shown via immunohistochemistry above, where AFP increases at day 11 and is virtually nonexistent at day 22 in both treatment groups. A–D 200×. Abbreviations: GSI XX, γ-secretase inhibitor; PH, partial hepatectomy; 2AAF-PH, 2-acetylaminofluorine implantation followed by 70% surgical resection of the liver; AFP, alpha-fetoprotein.
Figure 5
Figure 5
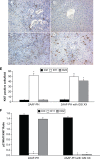
Inhibition of Notch signaling enhances proliferative capacity. A–D) Immunohistochemical analysis of Ki67 expression at days 11 and 22 post-PH in both treatment groups, 2AAF-PH alone (A and B) as well as in combination with GSI XX treatment (C and D). In the 2AAF-PH group, there is a dramatic increase in Ki67 expression at day 11 post-PH (A), which drops back down by day 22 post-PH (B), because the regeneration process has generally been completed by this point. In the GSI XX-treated group, similar levels of Ki67 staining are seen at day 11 post-PH (C), but this elevated expression level remains at day 22 post-PH when Notch signaling is inhibited (D). E) Semiquantitative analysis of Ki67 positivity in both treatment groups for control, day 11 post-PH, and day 22 post-PH samples, showing the number of Ki67-positive cells per field. F) Hepatocellular mitoinhibition index, determined by the ratio of p21Waf1:Ki67 (replicative arrest:proliferation). Notes: This index is drastically reduced in the GSI XX-treated group as compared with 2AAF-PH alone. Significance was calculated compared with control animals. *P < 0.01. A–D 200×. Abbreviations: GSI XX, γ-secretase inhibitor; PH, partial hepatectomy; 2AAF-PH, 2-acetylaminofluorine implantation followed by 70% surgical resection of the liver.
Figure 6
Figure 6
Lack of Notch expression leads to generation of functionally impaired hepatocytes. A–D) Immunohistochemical analysis of CYP3A2 expression at days 11 and 22 post-PH in both treatment groups, 2AAF-PH alone (A and B), as well as in combination with GSI XX treatment (C and D). In the 2AAF-PH group, there is a small amount of CYP3A2 expression at day 11 post-PH (A), which has significantly increased by day 22 post-PH (B), because the regeneration process has generally been completed by this point. In the GSI XX-treated group absolutely no CYP3A2 staining is seen at day 11 post-PH (C), and the levels increase only minimally by day 22 post-PH when Notch signaling is inhibited (D). A–D 200×. E) Top: Western analysis performed on protein isolated from liver taken at day 11 and day 22 post-PH from both treatment groups and probed with an antibody specific for the enzyme G6Pase-α. During 2AAF-PH alone, expression of G6Pase-α increases at day 11 post-PH and is even further elevated by day 22 post-PH, indicative of the formation of mature and functional hepatocytes. However, in the GSI XX-treated group, there is not as significant an increase in G6Pase-α levels at day 11, a difference that is even more pronounced in the day 22 post-PH sample. Bottom: semiquantitative analysis of G6Pase-α protein in both treatment groups for control, day 11 post-PH, and day 22 post-PH samples. Expression was normalized to β-actin and significance calculated compared with control animals. Notes: *P < 0.01. Abbreviations: GSI XX, γ-secretase inhibitor; PH, partial hepatectomy; 2AAF-PH, 2-acetylaminofluorine implantation followed by 70% surgical resection of the liver; G6Pase-α, glucose-6-phosphatase-α.
Figure 7
Figure 7
Regulation of hepatic oval cell differentiation via Notch signaling. Diagram depicting the involvement of Notch signaling in the differentiation of stem/progenitor cells. Left: in the case of a general bipotential cell, the up- or downregulation of Notch signaling decides the fate of that cell. In the absence of the Notch signal, the cell will assume a primary fate; however, when Notch signaling is activated, that cell will develop into the secondary phenotype. Middle: Applying this concept to the oval cell system during liver regeneration, we find that Notch signaling is necessary for the proper ratio of differentiation to occur. When Notch signaling is active, we see the oval cells assuming both hepatocyte and cholangiocyte phenotypes, but in the absence of the signal. Right: Proper maturation fails to occur, an apparent arrest in the differentiation capacity of the oval cells.

Similar articles

Cited by

References

    1. Artavanis-Tsakonas S, Matsuno K, Fortini ME. Notch signaling. Science. 1995;268:225–232. - PubMed
    1. Artavanis-Tsakonas S, Rand MD, Lake RJ. Notch signaling: Cell fate control and signal integration in development. Science. 1999;284:770–776. - PubMed
    1. Meile L, Osborne BA. Arbiter of differentiation: Notch signaling meets apoptosis. J Cell Physiol. 1999;181:393–409. - PubMed
    1. Milner LA, Bigas A. Notch as a mediator of cell fate determination in hematopoiesis: Evidence and speculation. Blood. 1999;93:2431–2448. - PubMed
    1. Weinmaster G. Notch signal transduction: A real rip and more. Curr Opin Genet Dev. 2000;10:363–369. - PubMed

LinkOut - more resources

  NODES
Note 3
twitter 2