. 2011 Nov 2;31(44):15629-39.
doi: 10.1523/JNEUROSCI.2526-11.2011.

Modulation of GABA transport by adenosine A1R-A2AR heteromers, which are coupled to both Gs- and G(i/o)-proteins

Affiliations

Modulation of GABA transport by adenosine A1R-A2AR heteromers, which are coupled to both Gs- and G(i/o)-proteins

Sofia Cristóvão-Ferreira et al. J Neurosci. .

Retraction in

Abstract

Astrocytes play a key role in modulating synaptic transmission by controlling the available extracellular GABA via the GAT-1 and GAT-3 GABA transporters (GATs). Using primary cultures of rat astrocytes, we show here that an additional level of regulation of GABA uptake occurs via modulation of the GATs by the adenosine A(1) (A(1)R) and A(2A) (A(2A)R) receptors. This regulation occurs through a complex of heterotetramers (two interacting homodimers) of A(1)R-A(2A)R that signal via two different G-proteins, G(s) and G(i/o), and either enhances (A(2A)R) or inhibits (A(1)R) GABA uptake. These results provide novel mechanistic insight into how G-protein-coupled receptor heteromers signal. Furthermore, we uncover a previously unknown mechanism in which adenosine, in a concentration-dependent manner, acts via a heterocomplex of adenosine receptors in astrocytes to significantly contribute to neurotransmission at the tripartite (neuron-glia-neuron) synapse.


Figures
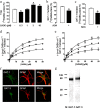
Figure 1.
Figure 1.
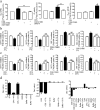
Adenosine receptor activation modulates [3H]GABA uptake in astrocytes. Astrocytes were incubated with medium or with increasing CADO concentrations (a) or 1 U/ml ADA (b, c), and the total [3H]GABA uptake (a) or GAT-1-mediated (b) or GAT-3-mediated (c) uptake was determined. In d and e, uptake kinetics was determined using increasing [3H]GABA concentrations. The A2AR agonist CGS 21680 (30 nm, squares) enhanced and the A1R agonist CPA (30 nm, triangles) decreased the GAT-1-mediated (d) or GAT-3-mediated (e) uptake (control uptake: circles) (Vmax of GAT-1, 25.1 ± 1.7 pmol GABA/min vs 14.9 ± 0.9 pmol GABA/min of control, *p < 0.01, n = 6; and Vmax of GAT-3, 30.9 ± 1.6 pmol GABA/min vs 22.5 ± 1.6 pmol GABA/min of control, *p < 0.001, n = 6) with no changes in KM values (GAT-1, 4.9 ± 0.5 vs 5.0 ± 0.8 μm, p > 0.05, n = 6; GAT-3, 17.6 ± 2.2 vs 18.2 ± 2.7 μm, p > 0.05, n = 6). In f, for immunohistochemistry analysis of GAT-1 (green, top row) and GAT-3 (green, bottom row) expression by astrocytes, GFAP (red) was used as astrocyte marker. In g, solubilized astrocytes were analyzed by SDS-PAGE and immunoblotted using rabbit anti-GAT-1 antibody (1:100) or rabbit anti-GAT-3 antibody (1:200) (M, molecular mass markers). Results in a–e are shown as mean ± SEM of four to six independent experiments. Statistical significance was calculated by one-way ANOVA, followed by Bonferroni's multiple comparison test; *p < 0.01 compared with control (white bars).
Figure 2.
Figure 2.
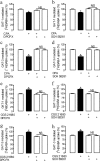
Inhibition of [3H]GABA uptake is promoted by A1R, whereas facilitation is mediated by A2AR. Astrocytes were treated for 15 min with 1 U/ml ADA (see Materials and Methods) before the addition of medium, the A1R antagonist DPCPX (50 nm), or the A2AR antagonist SCH 58261 (50 nm). After 20 min, the A1R agonist CPA (30 nm) (a–d) or the A2AR agonist CGS 21680 (30 nm) (e–h) were added, and the GAT-1 (a, b, e, f) or GAT-3 (c, d, g, h) mediated [3H]GABA uptake was measured as indicated in Materials and Methods. Results are mean ± SEM of six independent experiments. Statistical significance was calculated by one-way ANOVA followed by Bonferroni's multiple comparison test; *p < 0.001 compared with control (white bar); NS, p > 0.05.
Figure 3.
Figure 3.
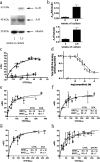
A1R–A2AR heteromers in astrocytes. In a, the expression of A1R and A2AR in astrocytes after different weeks of culture was detected by Western blot as indicated in Materials and Methods using α-tubulin as loading control. Averaged (n = 3) densitometric analysis of immunoblots is shown in b. In c and e–h, BRET saturation experiments were performed using 2-week cultured astrocytes (c) or HEK-293 cells (e–h) cotransfected with 1.5 μg (c) or 1 μg (e–h) cDNA corresponding to A2AR–RLuc and increasing amounts of cDNA corresponding to A1R–YFP (squares) or 5-HT2B–YFP (triangles, as negative control) constructs. In e–h, cells were treated for 10 min with medium (squares, solid line) or with 30 nm CGS 21680 (e), 30 nm CPA (f), 50 nm SCH 58261 (g), or 50 nm DPCPX (h) (circles, dotted lines). The BRETmax and BRET50 values are shown in the insets. Both fluorescence and luminescence of each sample were measured before every experiment to confirm similar donor expressions (∼100,000 luminescent units) while monitoring the increase acceptor expression (500–10,000 fluorescent units). Data are means ± SD of three different experiments grouped as a function of the amount of BRET acceptor. In d, competition experiments of 0.8 nm [3H]R-PIA versus increasing concentrations of the A2AR agonist CGS 21680 (solid line) or the A2AR antagonist SCH 58261 (dotted line) were performed using astrocytic membranes (0.18 mg protein/ml). Data are mean ± SEM of a representative experiment (n = 3) performed in triplicate.
Figure 4.
Figure 4.
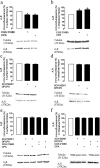
A1R or A2AR activation (but not its blockade) in astrocytes promotes internalization of A1R and A2AR. Astrocytes were incubated for 30 min with the A1R agonist CPA (30 nm) or with the A2AR agonist CGS 21680 (30 nm), alone (a, b) or in the presence of either the A1R antagonist DPCPX (50 nm) or the A2AR antagonist SCH 58261 (50 nm) (e, f) or only with DPCPX (50 nm) or SCH 58261 (50 nm) (c, d), before starting the biotinylation protocol. When testing the action of agonists in the presence of antagonists, the antagonists were added 15 min before the agonists. A1R expression at surface membranes (left panels) and intracellular fraction (right panels) was determined as indicated in Materials and Methods. Results are mean ± SEM of five independent experiments. Statistical significance was calculated by one-way ANOVA followed by Bonferroni's multiple comparison test; *p < 0.001 compared with control (100%, white bar).
Figure 5.
Figure 5.
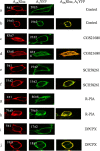
A1R and A2AR are internalized together during exposure to either A1R or A2AR agonists. HEK-293 cells were transfected with 1 μg of cDNA corresponding to A2AR–RLuc (red) or 1 μg of cDNA corresponding to A1R–YFP (green) (a, c, e, g, i) or both (b, d, f, h), and, 48 h after transfection cells, were treated for 60 min with medium (a, b), 100 nm A2AR agonist CGS 21680 (c, d), 1 μm A2AR antagonist SCH 58261 (e, f), 100 nm A1R agonist R-PIA (g, h), or 1 μm A1R antagonist DPCPX (i, j). Immunocytochemistry was performed as indicated in Materials and Methods, and A2AR–RLuc was labeled with the anti-RLuc antibody, and A1R–YFP was detected by its fluorescence properties. Colocalization was shown in yellow. The quantification of receptor internalization after the exposure to ligands was determined by analyzing, for each condition, 40–50 cells from 12 different fields in three independent preparations by confocal microscopy. Values are expressed as mean ± SEM.
Figure 6.
Figure 6.
A1R–A2AR heteromer in astrocytes is coupled to both Gs and Gi/o. In a, [35S]GTP-γ assays was performed as described in Materials and Methods to test Gi/o activity (left), Gs activity (middle), or Gq/11 activity (right) using membranes from astrocytes treated for 10 min with medium, the A2AR antagonist SCH 58261 (50 nm), or the A1R antagonist DPCPX (50 nm) before the activation with A2AR agonist CGS 21680 (30 nm) or A1R agonist CPA (30 nm) or ACh (10 μm) as positive control. In b and c, astrocytes were treated with medium, PTx (b, 5 μg/ml), or ChTx (c, 5 μg/ml) before stimulation with CPA (30 nm) or CGS 21680 (30 nm), and GAT-1- and GAT-3-mediated [3H]GABA uptake was measured as indicated in Materials and Methods. Toxins were preincubated with the astrocytes for 4 h and then removed before uptake assays. d, CellKey label-free assays were performed in CHO cells stable expressing A1R (left), A2AR (middle), or both (right), treated with medium, PTx (10 ng/ml), or ChTx (100 ng/ml), and stimulated or not with CGS 21680 (10 nm) or CPA (10 nm). Results are as mean ± SEM from four to eight independent experiments. Statistical significance was calculated by one-way ANOVA followed by Bonferroni's multiple comparison test; *p < 0.001 compared with control (100%, white bar), ** p < 0.001 compared with cells treated only with the agonist. NS, p > 0.05.
Figure 7.
Figure 7.
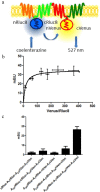
Heterotetramers formed by A1R–A1R and A2AR–A2AR homodimers. Heterotetramers constituted by two A1R and two A2AR protomers were demonstrated by BRET with BiLFC assays (see Materials and Methods). In a, a schematic representation of the technique is given. One receptor fused to the N-terminal fragment (nRluc8) and another receptor fused to the C-terminal fragment (cRluc8) of the Rluc8 act as BRET donor after Rluc8 reconstitution by a close receptor–receptor interaction and one receptor fused to an YFP Venus N-terminal fragment (nVenus) and another receptor fused to the YFP Venus C-terminal fragment (cVenus) act as BRET acceptor after YFP Venus reconstitution by a close receptor–receptor interaction. In b, BRET saturation curve was obtained in HEK-293 cells cotransfected with 1.5 μg of the two cDNA corresponding to A1R–nRLuc8 and A2AR–cRLuc8 and with increasing amounts of the two cDNAs corresponding to A1R–nVenus and A2AR–cVenus (equal amounts of the two cDNAs). mBU (net BRET × 1000; see Materials and Methods) are represented in front of the ratio between the fluorescence of the acceptor and the luciferase activity of the donor (YFP/RLuc). In c, results from cells expressing equivalent amounts of A1R–nRLuc8, A2AR–cRLuc8, and A1R–nVenus or A2AR–cVenus, expressing A1R–nVenus, A2AR–cVenus, and A1R–nRLuc8 or A2AR–cRLuc8, expressing A1R–nRLuc8, A2AR–cRLuc8, and YFP Venus, or expressing A1R–nVenus, A2AR–cVenus, and RLuc8 are given as negative controls and compared with a positive control. Data are means ± SD of three different experiments grouped as a function of the amount of BRET acceptor.
Figure 8.
Figure 8.
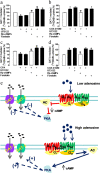
A1R–A2AR heteromer signaling. Astrocytes were treated for 15 min with 1 U/ml ADA (see Materials and Methods) before the addition of medium, the PLC inhibitor U73122 (3 μm), the PKA inhibitor Rp-cAMPs (100 μm), or the AC enhancer forskolin (10 μm). After 20 min, the A1R agonist CPA (30 nm) (a, c) or the A2AR agonist CGS 21680 (30 nm) (b, d) were added, and the GAT-1-mediated (a, b) or GAT-3-mediated (c, d) mediated [3H]GABA uptake was measured as indicated in Materials and Methods. Results are mean ± SEM from 4–10 independent experiments. Statistical significance was calculated by one-way ANOVA followed by Bonferroni's multiple comparison test; *p < 0.001 versus control (100%, white columns), ϕp < 0.001 versus cells treated with the agonist alone. e, Schematic representation of A1R–A2AR heteromer function. At low levels, adenosine binds preferentially to the A1R protomer of the heteromer, which will activate Gi/o-protein, and through a mechanism that involves AC and PKA activity, leads to a decrease (−) in GABA uptake mediated by GAT-1 and GAT-3. At higher concentrations, adenosine activates the A2AR protomer of the heteromer inhibiting A1R and, through Gs-protein, couples to the AC/cAMP/PKA pathway, leading to an enhancement (+) of GABA uptake.

Similar articles

Cited by

References

    1. Artola A, Singer W. Long-term potentiation and NMDA receptors in rat visual cortex. Nature. 1987;330:649–652. - PubMed
    1. Awad JA, Johnson RA, Jakobs KH, Schultz G. Interactions of forskolin and adenylate cyclase. Effects on substrate kinetics and protection against inactivation by heat and N-ethylmaleimide. J Biol Chem. 1983;258:2960–2965. - PubMed
    1. Blatow M, Rozov A, Katona I, Hormuzdi SG, Meyer AH, Whittington MA, Caputi A, Monyer H. A novel network of multipolar bursting interneurons generates theta frequency oscillations in neocortex. Neuron. 2003;38:805–817. - PubMed
    1. Bokoch GM, Gilman AG. Inhibition of receptor-mediated release of arachidonic acid by pertussis toxin. Cell. 1984;39:301–308. - PubMed
    1. Canals M, Marcellino D, Fanelli F, Ciruela F, de Benedetti P, Goldberg SR, Neve K, Fuxe K, Agnati LF, Woods AS, Ferré S, Lluis C, Bouvier M, Franco R. Adenosine A2A-dopamine D2 receptor-receptor heteromerization: qualitative and quantitative assessment by fluorescence and bioluminescence energy transfer. J Biol Chem. 2003;278:46741–46749. - PubMed

Publication types

MeSH terms

LinkOut - more resources

  NODES
INTERN 5
twitter 2