. 2012 Feb;22(2):322-31.
doi: 10.1101/gr.131508.111. Epub 2011 Dec 16.

Cooperation between Polycomb and androgen receptor during oncogenic transformation

Affiliations

Cooperation between Polycomb and androgen receptor during oncogenic transformation

Jonathan C Zhao et al. Genome Res. 2012 Feb.

Abstract

Androgen receptor (AR) is a hormone-activated transcription factor that plays important roles in prostate development and function, as well as malignant transformation. The downstream pathways of AR, however, are incompletely understood. AR has been primarily known as a transcriptional activator inducing prostate-specific gene expression. Through integrative analysis of genome-wide AR occupancy and androgen-regulated gene expression, here we report AR as a globally acting transcriptional repressor. This repression is mediated by androgen-responsive elements (ARE) and dictated by Polycomb group protein EZH2 and repressive chromatin remodeling. In embryonic stem cells, AR-repressed genes are occupied by EZH2 and harbor bivalent H3K4me3 and H3K27me3 modifications that are characteristic of differentiation regulators, the silencing of which maintains the undifferentiated state. Concordantly, these genes are silenced in castration-resistant prostate cancer rendering a stem cell-like lack of differentiation and tumor progression. Collectively, our data reveal an unexpected role of AR as a transcriptional repressor inhibiting non-prostatic differentiation and, upon excessive signaling, resulting in cancerous dedifferentiation.


Figures
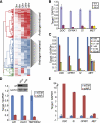
Figure 1.
Figure 1.
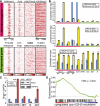
Androgen signaling represses a large set of _target genes. (A) Heatmap view of three clusters of genes in responding to time-course androgen treatment. LNCaP cells were hormone-starved for 3 d and treated with 1 nM R1881 for 0, 3, 6, 12, 24, and 48 h. Gene expression was normalized to 0 h. Each row corresponds to one gene, and each column corresponds to a single expression microarray. Candidate genes selected for further validation are marked. (B) QRT-PCR analysis confirmed repression of five candidate genes over a time course. (C) QRT-PCR analysis revealed dose-dependence repression of five candidate genes. (D) AR knockdown suppresses androgen-induced KLK3 and TMPRSS2 genes. LNCaP cells were treated with siRNAs _targeting AR or control. The level of AR knockdown was confirmed by both qRT-PCR and immunoblot (inset). The expressional changes of representative AR-induced genes were assayed by qRT-PCR. (E) AR knockdown derepresses androgen-repressed genes. The expression level of candidate genes in LNCaP cells treated with siRNAs _targeting AR or control were measured by qRT-PCR. Error bars: n = 3, mean ± SEM. P < 0.01 relative to control treatment for all experiments.
Figure 2.
Figure 2.
AR directly binds regulatory elements of androgen-repressed genes. (A) AR binding density of regions surrounding the highest peak (±5 kb) of genes induced, unregulated, or inhibited by androgen. AR ChIP-seq was performed in LNCaP cells treated with ethanol (Ethl) or synthetic androgen R1881 for 16 h. Each row represents one gene, and each column represents the binding intensity in each 100-bp window of the corresponding ChIP-seq experiment. Genes were sorted by the height of their highest AR binding peak in R1881 condition. AR ChIP-seq in Ethl condition was ranked according to R1881 condition. (B) Distribution of AR binding sites relative to AR-induced or AR-repressed genes. AR binding sites within the regulatory regions of AR-induced or -repressed genes were further categorized into promoter (within 5 kb upstream of the TSS site), enhancer, exon, and intron regions. (C) The most conserved DNA sequence motifs found in the AR binding sites of AR-induced and -repressed genes. De novo motif search was performed using MDscan of the top 500 AR binding sites associated with either AR-induced or -repressed genes. (D) ChIP-seq AR binding peaks on the regulatory elements of candidate AR-repressed genes. Genomic PCR primers (indicated by red arrows) were designed to flank the binding peaks. (E) AR directly binds to the regulatory elements of candidate AR-repressed genes in LNCaP cells. AR ChIP was done in LNCaP cells treated with Ethl or R1881 for 16 h. ChIP-PCR was performed using primers specific to each candidate gene (red arrows in D), KLK3, and a negative control, KIAA0066. Error bars: n = 3, mean ± SEM. (F) ChIP-PCR demonstrated AR binding to repressed genes in prostate cancer tissue. AR ChIP was performed in two human prostate cancer tissues. The input and ChIP DNA were first amplified by ligation-mediated PCR, and then an equal amount (50 ng) of the amplicons was used for PCR analysis of _target genes. Enrichment in the ChIP DNA was measured relative to the input DNA. Error bars: n = 3, mean ± SEM.
Figure 3.
Figure 3.
Pioneering factors FOXA1 and H3K4 mono- and di-methylation colocalize with AR at _target loci. (A) ChIP-seq binding density of regions surrounding the TSS (−50 kb to +5 kb) of AR-induced or -repressed genes. AR ChIP-seq was performed in hormone-starved LNCaP cells treated with ethanol (Ethl) and androgen (R1881). All other ChIP-seq was performed in LNCaP cells grown in regular medium. AR-induced and -repressed genes were each sorted by the distance of the highest AR (R1881) binding peak to the TSS of its corresponding genes; the genes with the highest AR binding peak most upstream of its TSS were ranked on top. Genes that do not contain a peak within −50 to 5 kb of its TSS were ranked at the bottom of each. The P-values indicate differences between the read densities of the two groups of genes. (B) QRT-PCR validation of reduced AR coactivating factor binding on the AR-regulated genes. ChIP of AR, FOXA1, H3K4me2, H3K4me2, and Acetyl H3 were performed in hormone-starved LNCaP cells treated with ethanol (Ethl) or androgen (R1881) for 16 h. PCR quantification was carried out using primers flanking the promoters of KLK3 and TMPRSS2 (negative control for AR and FOXA1 binding) and the enhancers of all genes. Marks with significant differences between AR-induced and -repressed genes include H3K4me1 (ethl), H3K4me2 (ethl), and H3 acetyl (R1881) with P-values equal to 0.04, 0.01, and 0.009, respectively. Error bars: n = 3, mean ± SEM.
Figure 4.
Figure 4.
AR-mediated transcriptional repression is dictated by Polycomb group protein EZH2. (A) ChIP-seq binding density of regions surrounding the TSS (±5 kb except −5 to 50 kb for H3k36me3) of AR-induced or -repressed genes. Genes were sorted as in Figure 3A except that those not containing a binding peak are not shown. The P-values indicate significant differences between the binding densities of AR-induced and -repressed genes. (B) Quantitative ChIP-PCR validating AR cofactor binding on AR-regulated genes. ChIP-PCR was performed as described in Figure 3B. Marks with at least marginally significant differences between AR-induced and -repressed genes include Pol II (R1881), H3K27me3 (Ethl), and H3K27me3 (R1881) with P-values equal to 0.05, 0.09, and 0.05, respectively. Error bars: n = 3, mean ± SEM. (C) EZH2 knockdown derepresses AR-repressed genes. LNCaP cells were subjected to RNA interference of EZH2 or a non-_targeting control. Differential expression of EZH2 and AR-repressed genes was monitored by qRT-PCR. (Inset) Western blot confirming EZH2 knockdown at the protein level. Error bars: n = 3, mean ± SEM. (D) GSEA showing enrichment of AR-repressed genes in the genes up-regulated by EZH2 knockdown. LNCaP cells were treated with siEZH2 and subjected to expression profiling. The genes differentially regulated by siEZH2 were rank ordered and the enrichment of AR-repressed genes assessed.
Figure 5.
Figure 5.
AR-repressed genes are developmental regulators involved in cell differentiation. (A) Network view of the molecular concepts enriched for AR-repressed genes (purple node with black ring). Each node represents a molecular concept or a gene set, with node size proportional to the number of genes within each concept. Each edge represents a statistically significant (P < 1 × 10⁻⁴) (Supplemental Table S3) overlap of genes in the two linked nodes. Enrichments with “androgen signaling” (light blue edges and nodes); enrichments with “developmental signatures” (dark blue); enrichments with “Polycomb repression signatures” (red); and enrichments with “repressed genes in aggressive tumors” (green). (B) ChIP-seq read density of regions surrounding the TSS (−5 to 50 kb for H3K36me3 and ±5 kb for others) of AR-induced or -repressed genes. ChIP-seq data in ES cells were obtained from GSE13084.
Figure 6.
Figure 6.
AR repression is maintained by Polycomb in castration-resistant prostate cancer. (A) QRT-PCR analysis of AR-repressed and -induced genes in androgen-sensitive LNCaP and castration-resistant LNCaP-abl cells. LNCaP cells were hormone-starved for 72 h before treatment with ethanol (E) or androgen (R) for 48 h. LNCaP-abl cells were maintained in a hormone-free medium. _target gene expression was first normalized to GAPDH and then to its level at LNCaP treated with ethanol. Error bars: n = 3, mean ± SEM. (B) QRT-PCR analysis of AR-induced genes in androgen-sensitive LNCaP and castration-resistant LNCaP-abl cells. (C) H3K27me3 modification on AR-repressed genes. LNCaP cells were hormone-starved for 72 h and treated with ethanol (E) or androgen (R) for 16 h before ChIP experiments. LNCaP-abl cells were maintained in a hormone-free medium. Error bars: n = 3, mean ± SEM. (D) GSEA showing enrichment of AR-repressed genes with genes down-regulated in LNCaP-abl compared with LNCaP. Gene expression in LNCaP and LNCaP-abl under an androgen-depleted environment was determined. Differentially expressed genes were ranked from up-regulated in LNCaP-abl to down-regulated in LNCaP-abl relative to LNCaP.

Similar articles

Cited by

References

    1. Baniwal SK, Khalid O, Sir D, Buchanan G, Coetzee GA, Frenkel B 2009. Repression of Runx2 by androgen receptor (AR) in osteoblasts and prostate cancer cells: AR binds Runx2 and abrogates its recruitment to DNA. Mol Endocrinol 23: 1203–1214 - PMC - PubMed
    1. Chen CD, Welsbie DS, Tran C, Baek SH, Chen R, Vessella R, Rosenfeld MG, Sawyers CL 2004. Molecular determinants of resistance to antiandrogen therapy. Nat Med 10: 33–39 - PubMed
    1. Cunha GR, Ricke W, Thomson A, Marker PC, Risbridger G, Hayward SW, Wang YZ, Donjacour AA, Kurita T 2004. Hormonal, cellular, and molecular regulation of normal and neoplastic prostatic development. J Steroid Biochem Mol Biol 92: 221–236 - PubMed
    1. Grosse A, Bartsch S, Baniahmad A 2011. Androgen receptor-mediated gene repression. Mol Cell Endocrinol doi: 10.1016/j.mce.2011.06.032 - PubMed
    1. He HH, Meyer CA, Shin H, Bailey ST, Wei G, Wang Q, Zhang Y, Xu K, Ni M, Lupien M, et al. 2010. Nucleosome dynamics define transcriptional enhancers. Nat Genet 42: 343–347 - PMC - PubMed

Publication types

MeSH terms

  NODES
Project 1
twitter 2