In vivo role of alternative splicing and serine phosphorylation of the microphthalmia-associated transcription factor
- PMID: 22367038
- PMCID: PMC3338255
- DOI: 10.1534/genetics.111.135996
In vivo role of alternative splicing and serine phosphorylation of the microphthalmia-associated transcription factor
Abstract
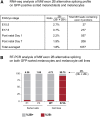
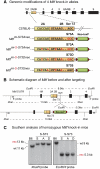
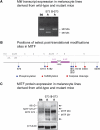
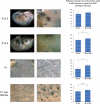
The microphthalmia-associated transcription factor (MITF) is a basic helix-loop-helix leucine zipper protein that plays major roles in the development and physiology of vertebrate melanocytes and melanoma cells. It is regulated by post-translational modifications, including phosphorylation at serine 73, which based on in vitro experiments imparts on MITF an increased transcriptional activity paired with a decreased stability. Serine 73 is encoded by the alternatively spliced exon 2B, which is preferentially skipped in mice carrying a _targeted serine-73-to-alanine mutation. Here, we measured the relative abundance of exon 2B+ and exon 2B- RNAs in freshly isolated and FACS-sorted wild-type melanoblasts and melanocytes and generated a series of knock-in mice allowing forced incorporation of either alanine, aspartate, or wild-type serine at position 73. None of these knock-in alleles, however, creates a striking pigmentation phenotype on its own, but differences between them can be revealed either by a general reduction of Mitf transcript levels or in heteroallelic combinations with extant Mitf mutations. In fact, compared with straight serine-73 knock-in mice with their relative reduction of 2B+ Mitf, forced incorporation of alanine 73 leads to greater increases in MITF protein levels, melanoblast and melanocyte numbers, and extent of pigmentation in particular allelic combinations. These results underscore, in vivo, the importance of the link between alternative splicing and post-translational modifications and may bear on the recent observation that exon 2B skipping can be found in metastatic melanoma.
Figures

Similar articles
-
Allele-specific genetic interactions between Mitf and Kit affect melanocyte development.Pigment Cell Melanoma Res. 2010 Jun;23(3):441-7. doi: 10.1111/j.1755-148X.2010.00699.x. Epub 2010 Mar 29. Pigment Cell Melanoma Res. 2010. PMID: 20374522 Free PMC article.
-
Expression and transcriptional activity of alternative splice variants of Mitf exon 6.Mol Cell Biochem. 2007 Sep;303(1-2):251-7. doi: 10.1007/s11010-007-9474-x. Epub 2007 Apr 25. Mol Cell Biochem. 2007. PMID: 17457519
-
The role of MITF phosphorylation sites during coat color and eye development in mice analyzed by bacterial artificial chromosome transgene rescue.Genetics. 2009 Oct;183(2):581-94. doi: 10.1534/genetics.109.103945. Epub 2009 Jul 27. Genetics. 2009. PMID: 19635938 Free PMC article.
-
MITF: master regulator of melanocyte development and melanoma oncogene.Trends Mol Med. 2006 Sep;12(9):406-14. doi: 10.1016/j.molmed.2006.07.008. Epub 2006 Aug 8. Trends Mol Med. 2006. PMID: 16899407 Review.
-
The roles of microphthalmia-associated transcription factor and pigmentation in melanoma.Arch Biochem Biophys. 2014 Dec 1;563:28-34. doi: 10.1016/j.abb.2014.07.019. Epub 2014 Aug 9. Arch Biochem Biophys. 2014. PMID: 25111671 Free PMC article. Review.
Cited by
-
Mitf regulates osteoclastogenesis by modulating NFATc1 activity.Exp Cell Res. 2014 Oct 15;328(1):32-43. doi: 10.1016/j.yexcr.2014.08.018. Epub 2014 Aug 22. Exp Cell Res. 2014. PMID: 25152440 Free PMC article.
-
A polymorphism in IRF4 affects human pigmentation through a tyrosinase-dependent MITF/TFAP2A pathway.Cell. 2013 Nov 21;155(5):1022-33. doi: 10.1016/j.cell.2013.10.022. Cell. 2013. PMID: 24267888 Free PMC article.
-
Tfe3 and Tfeb Transcriptionally Regulate Peroxisome Proliferator-Activated Receptor γ2 Expression in Adipocytes and Mediate Adiponectin and Glucose Levels in Mice.Mol Cell Biol. 2017 Jul 14;37(15):e00608-16. doi: 10.1128/MCB.00608-16. Print 2017 Aug 1. Mol Cell Biol. 2017. PMID: 28483914 Free PMC article.
-
Phenolic from apple blossom "Hongro" inhibits the expression of proteins related to melanogenesis in B16F10 melanoma cells.Food Sci Biotechnol. 2022 Oct 27;32(1):91-100. doi: 10.1007/s10068-022-01167-z. eCollection 2023 Jan. Food Sci Biotechnol. 2022. PMID: 36606089 Free PMC article.
-
Temperature-sensitive splicing of mitfa by an intron mutation in zebrafish.Pigment Cell Melanoma Res. 2015 Mar;28(2):229-32. doi: 10.1111/pcmr.12336. Epub 2014 Dec 29. Pigment Cell Melanoma Res. 2015. PMID: 25469769 Free PMC article. No abstract available.
References
-
- Arnheiter H., Hou L., Nguyen M. T. T., Bismuth K., Csermely T., et al. , 2006. Mitf—a matter of life and death for the developing melanocyte, From Melanocytes to Melanoma: The progression to Malignancy, edited by Hearing V., Leong S. P. L. Humana Press, Totowa, NJ.
-
- Bernex F., De Sepulveda P., Kress C., Elbaz C., Delouis C., et al. , 1996. Spatial and temporal patterns of c-kit-expressing cells in WlacZ/+ and WlacZ/WlacZ mouse embryos. Development 122: 3023–3033. - PubMed
Publication types
MeSH terms
Substances
Grants and funding
LinkOut - more resources
Full Text Sources
Molecular Biology Databases

