. 2012 Apr 13;149(2):483-96.
doi: 10.1016/j.cell.2012.02.052.

Large-scale cellular-resolution gene profiling in human neocortex reveals species-specific molecular signatures

Affiliations

Large-scale cellular-resolution gene profiling in human neocortex reveals species-specific molecular signatures

Hongkui Zeng et al. Cell. .

Abstract

Although there have been major advances in elucidating the functional biology of the human brain, relatively little is known of its cellular and molecular organization. Here we report a large-scale characterization of the expression of ∼1,000 genes important for neural functions by in situ hybridization at a cellular resolution in visual and temporal cortices of adult human brains. These data reveal diverse gene expression patterns and remarkable conservation of each individual gene's expression among individuals (95%), cortical areas (84%), and between human and mouse (79%). A small but substantial number of genes (21%) exhibited species-differential expression. Distinct molecular signatures, comprised of genes both common between species and unique to each, were identified for each major cortical cell type. The data suggest that gene expression profile changes may contribute to differential cortical function across species, and in particular, a shift from corticosubcortical to more predominant corticocortical communications in the human brain.


Conflict of interest statement

The authors have no conflict of interests.

Figures
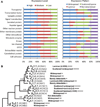
Figure 1
Figure 1
Range of gene expression profiles. (A) Percentages of genes with different expression levels (high, medium or low) or patterns (widespread, laminar, scattered/sparse, or not determined due to low or no expression) among different gene families. See also Figure S1, Table S1 and S2. (B) Diverse expression levels and patterns of the voltage-gated potassium channel subfamily. The phylogenetic tree (including the asterisks) is adopted from Yu and Catterall (Yu and Catterall, 2004) with permission.
Figure 2
Figure 2
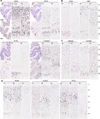
Cortical regional variation of gene expression. (A) Examples of genes defining the regional boundary between areas 17 and 18. For each gene, a Nissl-stained section (upper left panel) is shown alongside an ISH section (lower left panel) with enlarged views of areas 17 and 18 (middle and right panels). Arrowheads point to the visible borders between areas 17 and 18. (B) Examples of genes with differential expression in areas 17 and 18. TLE4 has denser expression in layer 6 of area 17 than 18. Expression of SST is largely absent in layer 4 of area 17 but not 18. (C) Examples of genes with differential expression in areas 18 and 21. GRIN3A has more enriched expression in layer 5 of area 21 but not 18. Expression of SCN3B is lower in layer 4 of area 18 but not 21. (D) Examples of genes with differential expression among areas 17, 18 and 21. Cortical layers are labeled on the right side of the figure.
Figure 3
Figure 3
Individual variation of gene expression. Three gene examples are shown, each with sections from 3 different donor specimens. Numbers shown next to each donor are Imod values for each tissue block. For VAMP1 both areas 17 and 18 are shown, whereas for RELN and DISC1 only area 17 is shown. Arrow points to the expression of RELN in layer 4C of just one donor. Cortical layers are labeled on the edges of the figure.
Figure 4
Figure 4
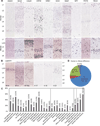
Gene expression difference between human and mouse. (A) Examples of genes with a variety of differential expression patterns between human and mouse visual cortices. Human area 17 is shown for ANXA1, BCL6, GRIK1, HCN1, NNAT, PDYN, and RELN. Human area 18 is shown for CALB1, CRYM, and NPY. Mouse areas are corresponding to each gene’s human area shown. Corresponding layers of human and mouse are marked on left. (B) The CARTPT gene has different expression patterns both across species and among different cortical regions within a species. M S1, mouse primary somatosensory cortex. M V1, mouse primary visual cortex. M TEa, mouse temporal association cortex. H 17, H 18, H 21, human cortical areas 17, 18, and 21. Cortical layers are labeled on the left for mouse and right for human. (C) Percent of genes in each gene category exhibiting human-mouse difference in expression (level or pattern combined) in visual cortex. The number of genes showing expression difference and the total number of genes in that category are shown in parentheses above each bar. See also Figure S2. (D) Cross-species comparison in both visual (vis) and temporal (te) cortices. The pie chart shows the number and percentage of genes (out of 611 total) with human-mouse expression difference (level or pattern combined) in either visual or temporal comparisons.
Figure 5
Figure 5
Cell type marker genes conserved between human and mouse. (A) Examples of genes with specific or enriched expression in different cortical layers or different interneuron populations. Corresponding layers of human and mouse are marked on left. Enriched expression patterns: C4orf31, layer 1; RASGRF2, layers 2/3; CUX2, layers 2/3/4; RORB, layer 4; TRIB2, layer 5A; B3GALT2, layers 5/6; NTNG2, layer 6; TLE4, layer 6; CTGF, layer 6B. Putative interneurons: CALB2, ERBB4, PVALB, TAC3, VIP. See also Figure S3. (B) Laminar delineation seen in human visual cortical sections under low magnification. For direct comparisons, sections for CUX2, RORB and B3GALT2 were from a common tissue block, and those for RASGRF2, TRIB2, NTNG2 and CTGF were from another tissue block. Arrowheads point to the borders between areas 17 and 18. Lines indicate pial surface within the sulci.
Figure 6
Figure 6
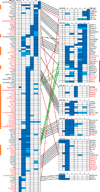
Species-differential molecular signatures of cortical layers. Mouse (left panel) and human (right panel) marker genes with selective expression in specific cortical layer(s) are clustered based on layers. Layers are marked at the top of each panel. WM, white matter. Layer(s) with predominant or secondary expression for each gene is labeled in dark or light blue, respectively. Names of the marker genes appearing in both mouse and human panels are shown in black, and names of those unique to mouse or human are shown in red. For each layer, the common set of mouse and human genes labeling the same layer are linked by black lines. The genes labeling different layers between mouse and human are linked by red lines, except that the genes with a switch from predominantly layer 5 or layers 5–6 expression in mouse to predominantly layer 3 or layers 2–3 expression in human are linked by green lines. The cluster of human genes showing a human-specific layer 3 expression pattern is indicated by a green vertical bar to the right of the human panel. The clusters of mouse genes showing mouse-specific layer 5 expression are indicated by the orange vertical bars to the left of the mouse panel. See also Figure S4.
Figure 7
Figure 7
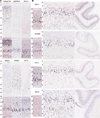
Downregulation of layer 5 and upregulation of layer 3 gene expression in the human cortex. (A) Representative genes with layer 5 specific or enriched expression in mouse but not human visual cortex. Expression changes include absence of layer 5 (or 5/6) expression in human (C20orf103, DEPDC6, MYL4), change from layer 5 enriched in mouse to scattered or widespread in human (NRIP3, PARM1), and much sparser layer 5 expression in human (VAT1L). (B) Representative genes with enhanced layer 3 expression in human associational cortex. The sparse (SNCG) or layer 5 enriched expression (NEFH, SCN4B, SYT2) in mouse area V2 (left panels) is in striking contrast with the specific (SCN4B, SYT2) or prominent (NEFH, SNCG) expression in layer 3 of human area 18 (middle panels, enlarged view; right panels, lower magnification showing the continuous band of layer 3 expression throughout the area). Corresponding layers of human (H) and mouse (M) are marked on left.

Similar articles

  • Shared and distinct transcriptomic cell types across neocortical areas.
    Tasic B, Yao Z, Graybuck LT, Smith KA, Nguyen TN, Bertagnolli D, Goldy J, Garren E, Economo MN, Viswanathan S, Penn O, Bakken T, Menon V, Miller J, Fong O, Hirokawa KE, Lathia K, Rimorin C, Tieu M, Larsen R, Casper T, Barkan E, Kroll M, Parry S, Shapovalova NV, Hirschstein D, Pendergraft J, Sullivan HA, Kim TK, Szafer A, Dee N, Groblewski P, Wickersham I, Cetin A, Harris JA, Levi BP, Sunkin SM, Madisen L, Daigle TL, Looger L, Bernard A, Phillips J, Lein E, Hawrylycz M, Svoboda K, Jones AR, Koch C, Zeng H. Tasic B, et al. Nature. 2018 Nov;563(7729):72-78. doi: 10.1038/s41586-018-0654-5. Epub 2018 Oct 31. Nature. 2018. PMID: 30382198 Free PMC article.
  • An anatomically comprehensive atlas of the adult human brain transcriptome.
    Hawrylycz MJ, Lein ES, Guillozet-Bongaarts AL, Shen EH, Ng L, Miller JA, van de Lagemaat LN, Smith KA, Ebbert A, Riley ZL, Abajian C, Beckmann CF, Bernard A, Bertagnolli D, Boe AF, Cartagena PM, Chakravarty MM, Chapin M, Chong J, Dalley RA, David Daly B, Dang C, Datta S, Dee N, Dolbeare TA, Faber V, Feng D, Fowler DR, Goldy J, Gregor BW, Haradon Z, Haynor DR, Hohmann JG, Horvath S, Howard RE, Jeromin A, Jochim JM, Kinnunen M, Lau C, Lazarz ET, Lee C, Lemon TA, Li L, Li Y, Morris JA, Overly CC, Parker PD, Parry SE, Reding M, Royall JJ, Schulkin J, Sequeira PA, Slaughterbeck CR, Smith SC, Sodt AJ, Sunkin SM, Swanson BE, Vawter MP, Williams D, Wohnoutka P, Zielke HR, Geschwind DH, Hof PR, Smith SM, Koch C, Grant SGN, Jones AR. Hawrylycz MJ, et al. Nature. 2012 Sep 20;489(7416):391-399. doi: 10.1038/nature11405. Nature. 2012. PMID: 22996553 Free PMC article.
  • Comparative analysis of layer-specific genes in Mammalian neocortex.
    Watakabe A, Ichinohe N, Ohsawa S, Hashikawa T, Komatsu Y, Rockland KS, Yamamori T. Watakabe A, et al. Cereb Cortex. 2007 Aug;17(8):1918-33. doi: 10.1093/cercor/bhl102. Epub 2006 Oct 25. Cereb Cortex. 2007. PMID: 17065549
  • Gene expression profiling of primate neocortex: molecular neuroanatomy of cortical areas.
    Watakabe A, Komatsu Y, Nawa H, Yamamori T. Watakabe A, et al. Genes Brain Behav. 2006;5 Suppl 1:38-43. doi: 10.1111/j.1601-183X.2006.00193.x. Genes Brain Behav. 2006. PMID: 16417616 Review.
  • Comparative molecular neuroanatomy of mammalian neocortex: what can gene expression tell us about areas and layers?
    Watakabe A. Watakabe A. Dev Growth Differ. 2009 Apr;51(3):343-54. doi: 10.1111/j.1440-169X.2008.01085.x. Epub 2009 Feb 16. Dev Growth Differ. 2009. PMID: 19222526 Review.

Cited by

References

    1. Abrahams BS, Tentler D, Perederiy JV, Oldham MC, Coppola G, Geschwind DH. Genome-wide analyses of human perisylvian cerebral cortical patterning. Proc. Natl. Acad. Sci. USA. 2007;104:17849–17854. - PMC - PubMed
    1. Ascoli GA, Alonso-Nanclares L, Anderson SA, Barrionuevo G, Benavides-Piccione R, Burkhalter A, Buzsaki G, Cauli B, Defelipe J, Fairen A, et al. Petilla terminology: nomenclature of features of GABAergic interneurons of the cerebral cortex. Nat. Rev. Neurosci. 2008;9:557–568. - PMC - PubMed
    1. Ayoub AE, Kostovic I. New horizons for the subplate zone and its pioneering neurons. Cereb. Cortex. 2009;19:1705–1707. - PubMed
    1. Burki F, Kaessmann H. Birth and adaptive evolution of a hominoid gene that supports high neurotransmitter flux. Nat. Genet. 2004;36:1061–1063. - PubMed
    1. Caceres M, Lachuer J, Zapala MA, Redmond JC, Kudo L, Geschwind DH, Lockhart DJ, Preuss TM, Barlow C. Elevated gene expression levels distinguish human from non-human primate brains. Proc. Natl. Acad. Sci. USA. 2003;100:13030–13035. - PMC - PubMed

Publication types

LinkOut - more resources

  NODES
Association 2
INTERN 3
Project 1
twitter 2