. 2012 Apr 17:3:783.
doi: 10.1038/ncomms1786.

Cancer cells that survive radiation therapy acquire HIF-1 activity and translocate towards tumour blood vessels

Affiliations
Free PMC article

Cancer cells that survive radiation therapy acquire HIF-1 activity and translocate towards tumour blood vessels

Hiroshi Harada et al. Nat Commun. .
Free PMC article

Erratum in

  • Nat Commun. 2013;4. doi:10.1038/ncomms3314

Abstract

Tumour recurrence frequently occurs after radiotherapy, but the characteristics, intratumoural localization and post-irradiation behaviour of radioresistant cancer cells remain largely unknown. Here we develop a sophisticated strategy to track the post-irradiation fate of the cells, which exist in perinecrotic regions at the time of radiation. Although the perinecrotic tumour cells are originally hypoxia-inducible factor 1 (HIF-1)-negative, they acquire HIF-1 activity after surviving radiation, which triggers their translocation towards tumour blood vessels. HIF-1 inhibitors suppress the translocation and decrease the incidence of post-irradiation tumour recurrence. For the first time, our data unveil the HIF-1-dependent cellular dynamics during post-irradiation tumour recurrence and provide a rational basis for _targeting HIF-1 after radiation therapy.


Figures

Figure 1
Figure 1. Luciferase-tagging of hypoxic cells by HIF-1- and tamoxifen-dependent site-specific recombination.
(a) Schematic diagram of CAGp/loxP-polyA-loxP-luciferase gene (upper) that results in luciferase expression after Cre-mediated deletion of floxed poly A signal (lower). (b) Schematic diagrams of CMVp-Cre (upper; expressing Cre constitutively), 5HREp/Cre–ODD (middle; expressing Cre–ODD in a HIF-1-dependent manner), 5HREp/Cre-ERT2–ODD (lower; expressing Cre-ERT2–ODD in a HIF-1-dependent manner) genes. (c) After transient transfection with the indicated gene constructs, cells were treated with (+) or without (−) estrogen or tamoxifen under normoxic or hypoxic conditions for 24 h and subjected to luciferase assay. Mean±s.d. n=3. The statistical significance of differences was determined using Student's t-test. **P<0.01. NS: not significant. (d) Stable transfectant with the 5HREp/Cre-ERT2–ODD gene and CAGp/loxP-polyA-loxP-luciferase gene was treated with tamoxifen under normoxic or hypoxic conditions for the indicated period and subjected to immunoblotting using antibodies against HIF-1α, or the myc epitope tag for the Cre-ERT2–ODD fusion protein. (e) After normoxic (white rhombus) or hypoxic (black square) treatment for the indicated period, the stable cell was subjected to Luciferase assay. Mean±s.d. n=3. **P<0.01 (Student's t-test). (f) Genomic DNA was extracted after the same treatment as (e) and subjected to semi-quantitative genomic PCR assay. The sizes of the marker bands (base pair) are shown. The primers used in the PCR assay are shown in (a) as dotted arrows.
Figure 2
Figure 2. Luciferase-tagging of hypoxic tumour cells in vivo.
(a) Optical imaging of mice bearing the tumour xenograft with the 5HREp/Cre-ERT2–ODD gene and CAGp/loxP-polyA-loxP-luciferase gene at the indicated time points after the single administration of tamoxifen. Reproducibility was confirmed in ten independent mice, and representative images are shown. (b) Bioluminescent intensity in (a). Mean±s.d. n=10. (c) Immunohistochemistry with anti-HIF-1α (red) and anti-luciferase (green) antibodies of the tumour xenografts at the indicated times after the single injection of tamoxifen. Blue: Hoechst 33342 (perfusion marker). Bar, 50 μm. Yellow is merged green and red, indicating the co-localization of HIF-1α and luciferase proteins. (d) High magnification images of the enclosed areas in c. Bar, 50 μm. (e) Changes in the percentage of luciferase-positive cells in the tumour sections in (c) at the indicated time points after the single tamoxifen treatment, were calculated with NIH Image 1.63 (ref. 29). Mean±s.d. n=20 fields in 5 independent sections.
Figure 3
Figure 3. Luciferase-tagging of hypoxic tumour cells in vivo.
(a) Immunohistochemistry with anti-HIF-1α (red), anti-pimonidazole (green), and anti-luciferase (blue) antibodies of tumour xenografts with the 5HREp/Cre-ERT2–ODD gene and CAGp/loxP-polyA-loxP-luciferase gene at the indicated time points after the single injection of tamoxifen. *: Blood vessel. Bar, 50 μm. Reproducibility was confirmed in 12 independent sections. (b) Distances between vasculatures and HIF-1-positive cells (white), and pimonidazole-positive cells (grey), or and luciferase-tagged cells (black) were measured in the tumour sections in (a). Mean±s.d. n=40 tumour cords in 12 independent sections. (c) Percentages of cells detected with the indicated combination of antibodies in the tumour sections of (a) were quantified with CellSens Dimension (Olympus). Mean±s.d. n=40 tumour cords in 12 independent sections.
Figure 4
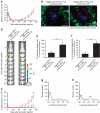
Figure 4. Fate of hypoxic tumour cells after radiation treatment.
(a) Tumour-bearing mice were γ-irradiated on either the first day after tamoxifen treatment when tagged cells were located in the HIF-1-positive cell area (blue rhombus; group name: tagged Cells in HIF-1 area), or the second day after tamoxifen treatment when the tagged cells were located in the pimonidazole-positive cell area (red square; group name: tagged cells in Pimo area). Relative tumour volume was calculated as the ratio of the tumour volume on each day to the corresponding volume on day 0. Mean±s.d. n=12. (b) During the experiment in (a), tumour-bearing mice were subjected to optical imaging at the indicated time points. Representative images are shown. (c) Bioluminescence intensities were quantified based on the optical imaging in (b). Blue rhombus: group of 'tagged cells in HIF-1 Area'. Red square: group of 'tagged Cells in Pimo area'. Mean±s.d. n=12. *P<0.05. **P<0.01 (Student's t-test). (d) The tumour xenografts in each group of the experiments (a–c) were surgically excised 91-days post-injection of tamoxifen and cut into two pieces. One of them was subjected to immunohistochemistry with anti-luciferase (red) and anti-pimonidazole (green) antibodies. Hoechst 33342: perfusion marker (blue). Bar, 50 μm. Reproducibility was confirmed in 40 tumour cords in 12 independent sections. (e) The number of luciferase-positive cells per tumour cord was counted in the tumour sections in (d). Mean±s.d. n=40 tumour cords in 12 independent sections. **P<0.01 (Student's t-test). (f) Single cell suspension was prepared from another piece of xenografts in (d) and subjected to flow cytometric analysis with anti-luciferase antibody to quantify percentage of luciferase-positive cells in the recurrent tumour of each group. Mean±s.d. n=12 independent tumour xenografts. **P<0.01 (Student's t-test). (g) Representative flow cytometric histogram in the 'tagged cells in HIF-1 area group'. Reproducibility was confirmed by using 12 independent xenografts. (h) Representative flow cytometric histogram in the 'tagged cells in Pimo area group'. Reproducibility was confirmed by using 12 independent xenografts.
Figure 5
Figure 5. Translocation of radio-surviving tumour cells.
(a) Schematic diagram of treatments in (b). The tumour-bearing mice were treated with 0 (−) or 25 (+) Gy of γ-rays on 2 days after tamoxifen injection. YC-1 was administered to suppress radiation-induced activation of HIF-1 (ref. 30). (b) Immunohistochemistry with anti-luciferase (red) and anti-pimonidazole (green) antibodies of the xenografts 4 days after the irradiation. Blue: Hoechst 33342. Bar, 50 μm. (c) The percentage of luciferase-positive cells on the indicated days was quantified in the unirradiated and DMSO-injected sections in (b). n=40 tumour cords in 12 sections. (d) The tumour-bearing mice were injected with (+) or without (−) YC-1 2 days after tamoxifen administration, and subjected to optical imaging on the indicated days. Representative images of 12 mice are shown. (e) The numbers of luciferase-positive cells in normoxic regions were quantified in the sections of (b). n=40 tumour cords in 12 sections. **P<0.01 (Student's t-test). (f) The numbers of luciferase-positive cells in pimonidazole-positive regions were quantified in the sections of (b). n=40 tumour cords in 12 sections. **P<0.01 (Student's t-test). (g) After transfection with the 5HREp/Cre-ERT2–ODD gene and CAGp/loxP-polyA-loxP-luciferase gene, antibiotic-resistant WiDr cells were selected with blasticidin. Tumour xenografts, with the resultant stable transfectant, were subjected to the same experiment as (a,b). The numbers of luciferase-positive cells in normoxic regions were quantified in the sections. n=40 tumour cords in 12 sections. **P<0.01 (Student's t-test). (h) The numbers of luciferase-positive cells in pimonidazole-positive regions were quantified in the experiment of (g) n=40 tumour cords in 12 sections. **P<0.01 (Student's t-test). (i) Schematic diagram of treatments in (j). The tumour xenografts, with HEK293 transfectant, were subjected to immunohistochemistry 1 day following the 0 (−) or 25 Gy (+) of radiation. (j) Immunohistochemistry with anti-luciferase (blue) and anti-HIF-1α (red) antibodies. Bar, 50 μm. Representative images of 12 xenografts are shown. (k) Percentages of luciferase and HIF-1α double-positive cells were quantified in the sections of (j). n=40 tumour cords in 12 sections. **P<0.01 (Student's t-test).
Figure 6
Figure 6. Therapeutic effect of the combination of radiation and a HIF-1 inhibitor.
(a) The tumour bearing mice were irradiated with γ-rays (25 Gy) and treated with or without YC-1 1 min after the irradiation to suppress the activation of HIF-1. Kaplan–Meier analysis of recurrence-free periods after irradiation alone (blue) or after the combination of radiation and a HIF-1 inhibitor (red). n=15. (b) During the experiment of (a), relative tumour volume was calculated as the ratio of the tumour volume on each day to the corresponding volume on day 0. Blue triangle: radiation alone group. Red square: radiation & YC-1 group. Mean±s.d. n=15. *P<0.05 (Student's t-test).

Similar articles

Cited by

References

    1. Hanahan D. & Weinberg R. A. The hallmarks of cancer. Cell 100, 57–70 (2000). - PubMed
    1. Thomlinson R. H. & Gray L. H. The histological structure of some human lung cancers and the possible implications for radiotherapy. Br. J. Cancer 9, 539–549 (1955). - PMC - PubMed
    1. Vaupel P., Kallinowski F. & Okunieff P. Blood flow, oxygen and nutrient supply, and metabolic microenvironment of human tumors: a review. Cancer Res. 49, 6449–6465 (1989). - PubMed
    1. Vaupel P., Hockel M. & Mayer A. Detection and characterization of tumor hypoxia using pO2 histography. Antioxid. Redox Signal. 9, 1221–1235 (2007). - PubMed
    1. Vaupel P., Schlenger K., Knoop C. & Hockel M. Oxygenation of human tumors: evaluation of tissue oxygen distribution in breast cancers by computerized O2 tension measurements. Cancer Res. 51, 3316–3322 (1991). - PubMed

Publication types

Substances

  NODES
admin 3
twitter 2