Cytotoxic effects of bortezomib in myelodysplastic syndrome/acute myeloid leukemia depend on autophagy-mediated lysosomal degradation of TRAF6 and repression of PSMA1
- PMID: 22685174
- PMCID: PMC3412348
- DOI: 10.1182/blood-2012-02-407999
Cytotoxic effects of bortezomib in myelodysplastic syndrome/acute myeloid leukemia depend on autophagy-mediated lysosomal degradation of TRAF6 and repression of PSMA1
Erratum in
- Blood. 2014 Jun 5;123(23):3682
Abstract
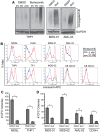
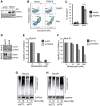
Bortezomib (Velcade) is used widely for the treatment of various human cancers; however, its mechanisms of action are not fully understood, particularly in myeloid malignancies. Bortezomib is a selective and reversible inhibitor of the proteasome. Paradoxically, we find that bortezomib induces proteasome-independent degradation of the TRAF6 protein, but not mRNA, in myelodysplastic syndrome (MDS) and acute myeloid leukemia (AML) cell lines and primary cells. The reduction in TRAF6 protein coincides with bortezomib-induced autophagy, and subsequently with apoptosis in MDS/AML cells. RNAi-mediated knockdown of TRAF6 sensitized bortezomib-sensitive and -resistant cell lines, underscoring the importance of TRAF6 in bortezomib-induced cytotoxicity. Bortezomib-resistant cells expressing an shRNA _targeting TRAF6 were resensitized to the cytotoxic effects of bortezomib due to down-regulation of the proteasomal subunit α-1 (PSMA1). To determine the molecular consequences of loss of TRAF6 in MDS/AML cells, in the present study, we applied gene-expression profiling and identified an apoptosis gene signature. Knockdown of TRAF6 in MDS/AML cell lines or patient samples resulted in rapid apoptosis and impaired malignant hematopoietic stem/progenitor function. In summary, we describe herein novel mechanisms by which TRAF6 is regulated through bortezomib/autophagy-mediated degradation and by which it alters MDS/AML sensitivity to bortezomib by controlling PSMA1 expression.
Figures


Similar articles
-
High basal nuclear levels of Nrf2 in acute myeloid leukemia reduces sensitivity to proteasome inhibitors.Cancer Res. 2011 Mar 1;71(5):1999-2009. doi: 10.1158/0008-5472.CAN-10-3018. Epub 2011 Jan 6. Cancer Res. 2011. PMID: 21212410
-
The effect of the proteasome inhibitor bortezomib on acute myeloid leukemia cells and drug resistance associated with the CD34+ immature phenotype.Haematologica. 2008 Jan;93(1):57-66. doi: 10.3324/haematol.11666. Haematologica. 2008. PMID: 18166786
-
p70S6 kinase is a _target of the novel proteasome inhibitor 3,3'-diamino-4'-methoxyflavone during apoptosis in human myeloid tumor cells.Biochim Biophys Acta. 2013 Jun;1833(6):1316-28. doi: 10.1016/j.bbamcr.2013.02.016. Epub 2013 Feb 26. Biochim Biophys Acta. 2013. PMID: 23481040
-
The ubiquitin-proteasome system (UPS) and the mechanism of action of bortezomib.Curr Pharm Des. 2011;17(15):1483-99. doi: 10.2174/138161211796197124. Curr Pharm Des. 2011. PMID: 21504411 Review.
-
Development of the proteasome inhibitor Velcade (Bortezomib).Cancer Invest. 2004;22(2):304-11. doi: 10.1081/cnv-120030218. Cancer Invest. 2004. PMID: 15199612 Review.
Cited by
-
Biology of the bone marrow microenvironment and myelodysplastic syndromes.Mol Genet Metab. 2015 Sep-Oct;116(1-2):24-8. doi: 10.1016/j.ymgme.2015.07.004. Epub 2015 Jul 20. Mol Genet Metab. 2015. PMID: 26210353 Free PMC article. Review.
-
PSMA1, a Poor Prognostic Factor, Promotes Tumor Growth in Lung Squamous Cell Carcinoma.Dis Markers. 2023 Feb 3;2023:5386635. doi: 10.1155/2023/5386635. eCollection 2023. Dis Markers. 2023. PMID: 36776923 Free PMC article.
-
Bortezomib enhances cancer cell death by blocking the autophagic flux through stimulating ERK phosphorylation.Cell Death Dis. 2014 Nov 6;5(11):e1510. doi: 10.1038/cddis.2014.468. Cell Death Dis. 2014. PMID: 25375375 Free PMC article.
-
Role of p62 in the suppression of inflammatory cytokine production by adiponectin in macrophages: Involvement of autophagy and p21/Nrf2 axis.Sci Rep. 2017 Mar 24;7(1):393. doi: 10.1038/s41598-017-00456-6. Sci Rep. 2017. PMID: 28341848 Free PMC article.
-
Bortezomib alters sour taste sensitivity in mice.Toxicol Rep. 2017 Mar 10;4:172-180. doi: 10.1016/j.toxrep.2017.03.003. eCollection 2017. Toxicol Rep. 2017. PMID: 28959638 Free PMC article.
References
-
- Corey SJ, Minden MD, Barber DL, Kantarjian H, Wang JC, Schimmer AD. Myelodysplastic syndromes: the complexity of stem-cell diseases. Nat Rev Cancer. 2007;7(2):118–129. - PubMed
-
- Nimer SD. Myelodysplastic syndromes. Blood. 2008;111(10):4841–4851. - PubMed
-
- Masonic Cancer Center, University of Minnesota. Bortezomib and vorinostat in treating patients with high-risk myelodysplastic syndrome or acute myeloid leukemia. [Accessed April 3, 2012]. Available from: http://clinicaltrials.gov/ct2/show/NCT00818649.
-
- Virginia Commonwealth University. Belinostat and bortezomib in treating patients with relapsed or refractory acute leukemia or myelodysplastic syndrome. [Accessed April 3, 2012]. Available from: http://clinicaltrials.gov/ct2/show/NCT01075425.
-
- Children's Oncology Group. Bortezomib and combination chemotherapy in treating younger patients with recurrent, refractory, or secondary acute myeloid leukemia. [Accessed April 3, 2012]. Available from: http://clinicaltrials.gov/ct2/show/NCT00666588.
Publication types
MeSH terms
Substances
Grants and funding
LinkOut - more resources
Full Text Sources
Other Literature Sources
Medical
Research Materials
Miscellaneous

