Spatio-temporal course of macrophage-like cell accumulation after experimental embolic stroke depending on treatment with tissue plasminogen activator and its combination with hyperbaric oxygenation
- PMID: 22688295
- PMCID: PMC3428963
- DOI: 10.4081/ejh.2012.14
Spatio-temporal course of macrophage-like cell accumulation after experimental embolic stroke depending on treatment with tissue plasminogen activator and its combination with hyperbaric oxygenation
Abstract
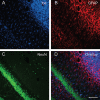
Inflammation following ischaemic stroke attracts high priority in current research, particularly using human-like models and long-term observation periods considering translational aspects. The present study aimed on the spatio-temporal course of macrophage-like cell accumulation after experimental thromboembolic stroke and addressed microglial and astroglial reactions in the ischaemic border zone. Further, effects of tissue plasminogen activator (tPA) as currently best treatment for stroke and the potentially neuroprotective co-administration of hyperbaric oxygen (HBO) were investigated. Rats underwent middle cerebral artery occlusion and were assigned to control, tPA or tPA+HBO. Twenty-four hours, 7, 14 and 28 days were determined as observation time points. The accumulation of macrophage-like cells was semiquantitatively assessed by CD68 staining in the ischaemic area and ischaemic border zone, and linked to the clinical course. CD11b, ionized calcium binding adaptor molecule 1 (Iba), glial fibrillary acidic protein (GFAP) and Neuronal Nuclei (NeuN) were applied to reveal delayed glial and neuronal alterations. In all groups, the accumulation of macrophage-like cells increased distinctly from 24 hours to 7 days post ischaemia. tPA+HBO tended to decrease macrophage-like cell accumulation at day 14 and 28. Overall, a trend towards an association of increased accumulation and pronounced reduction of the neurological deficit was found. Concerning delayed inflammatory reactions, an activation of microglia and astrocytes with co-occurring neuronal loss was observed on day 28. Thereby, astrogliosis was found circularly in contrast to microglial activation directly in the ischaemic area. This study supports previous data on long-lasting inflammatory processes following experimental stroke, and additionally provides region-specific details on glial reactions. The tendency towards a decreasing macrophage-like cell accumulation after tPA+HBO needs to be discussed critically since neuroprotective properties were recently ascribed to long-term inflammatory processes.
Conflict of interest statement
Conflict of interest: the authors declare no conflict of interest.
Figures


Similar articles
-
Long-lasting neuronal loss following experimental focal cerebral ischemia is not affected by combined administration of tissue plasminogen activator and hyperbaric oxygen.Brain Res. 2011 Oct 12;1417:115-26. doi: 10.1016/j.brainres.2011.08.024. Epub 2011 Aug 22. Brain Res. 2011. PMID: 21914554
-
Long-term functional and neurological outcome after simultaneous treatment with tissue-plasminogen activator and hyperbaric oxygen in early phase of embolic stroke in rats.Brain Res. 2009 Dec 15;1303:161-8. doi: 10.1016/j.brainres.2009.09.038. Epub 2009 Sep 18. Brain Res. 2009. PMID: 19766603
-
Combination treatment with N-acetyl-seryl-aspartyl-lysyl-proline and tissue plasminogen activator provides potent neuroprotection in rats after stroke.Stroke. 2014 Apr;45(4):1108-14. doi: 10.1161/STROKEAHA.113.004399. Epub 2014 Feb 18. Stroke. 2014. PMID: 24549864 Free PMC article.
-
Adjuvant treatment with neuroserpin increases the therapeutic window for tissue-type plasminogen activator administration in a rat model of embolic stroke.Circulation. 2002 Aug 6;106(6):740-5. doi: 10.1161/01.cir.0000023942.10849.41. Circulation. 2002. PMID: 12163437
-
A novel mouse model of thromboembolic stroke.J Neurosci Methods. 2015 Dec 30;256:203-11. doi: 10.1016/j.jneumeth.2015.09.013. Epub 2015 Sep 18. J Neurosci Methods. 2015. PMID: 26386284 Free PMC article. Review.
Cited by
-
Intranasal wnt3a Attenuates Neuronal Apoptosis through Frz1/PIWIL1a/FOXM1 Pathway in MCAO Rats.J Neurosci. 2018 Jul 25;38(30):6787-6801. doi: 10.1523/JNEUROSCI.2352-17.2018. Epub 2018 Jun 28. J Neurosci. 2018. PMID: 29954850 Free PMC article.
-
Neuroprotection for ischemic stroke: moving past shortcomings and identifying promising directions.Int J Mol Sci. 2013 Jan 17;14(1):1890-917. doi: 10.3390/ijms14011890. Int J Mol Sci. 2013. PMID: 23344061 Free PMC article. Review.
-
Neurorestorative Therapy of Stroke in Type 2 Diabetes Mellitus Rats Treated With Human Umbilical Cord Blood Cells.Stroke. 2015 Sep;46(9):2599-606. doi: 10.1161/STROKEAHA.115.009870. Epub 2015 Aug 4. Stroke. 2015. PMID: 26243222 Free PMC article.
-
Neurorestorative Responses to Delayed Human Mesenchymal Stromal Cells Treatment of Stroke in Type 2 Diabetic Rats.Stroke. 2016 Nov;47(11):2850-2858. doi: 10.1161/STROKEAHA.116.014686. Epub 2016 Oct 11. Stroke. 2016. PMID: 27729575 Free PMC article.
-
On the future contents of a small journal of histochemistry.Eur J Histochem. 2012 Dec 10;56(4):e51. doi: 10.4081/ejh.2012.e51. Eur J Histochem. 2012. PMID: 23361247 Free PMC article.
References
-
- Endres M, Engelhardt B, Koistinaho J, Lindvall O, Meairs S, Mohr JP, et al. Improving outcome after stroke: overcoming the translational roadblock. Cerebrovasc Dis. 2008;25:268–78. - PubMed
-
- Diener HC, Lees KR, Lyden P, Grotta J, Davalos A, Davis SM, et al. NXY-059 for the treatment of acute stroke: pooled analysis of the SAINT I and II Trials. Stroke. 2008;39:1751–8. - PubMed
-
- Meairs S, Wahlgren N, Dirnagl U, Lindvall O, Rothwell P, Baron JC, et al. Stroke research priorities for the next decade-A representative view of the European scientific community. Cerebrovasc Dis. 2006;22:75–82. - PubMed
-
- Young AR, Ali C, Duretête A, Vivien D. Neuroprotection and stroke: time for a compromise. J Neurochem. 2007;103:1302–9. - PubMed
-
- Bechmann I, Galea I, Perry VH. What is the blood-brain barrier (not)? Trends Immunol. 2007;28:5–11. - PubMed
MeSH terms
Substances
LinkOut - more resources
Full Text Sources
Medical
Research Materials
Miscellaneous

