The interplay of prefrontal and sensorimotor cortices during inhibitory control of learned motor behavior
- PMID: 22848201
- PMCID: PMC3404394
- DOI: 10.3389/fneng.2012.00017
The interplay of prefrontal and sensorimotor cortices during inhibitory control of learned motor behavior
Abstract
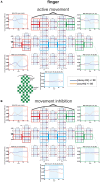
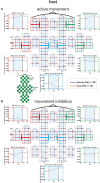
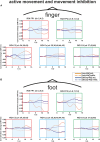
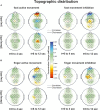
In the present study inhibitory cortical mechanisms have been investigated during execution and inhibition of learned motor programs by means of multi-channel functional near infrared spectroscopy (fNIRS). fNIRS is an emerging non-invasive optical technique for the in vivo assessment of cerebral oxygenation, concretely changes of oxygenated [oxy-Hb], and deoxygenated [deoxy-Hb] hemoglobin. Eleven healthy subjects executed or inhibited previous learned finger and foot movements indicated by a visual cue. The execution of finger/foot movements caused a typical activation pattern namely an increase of [oxy-Hb] and a decrease of [deoxy-Hb] whereas the inhibition of finger/foot movements caused a decrease of [oxy-Hb] and an increase of [deoxy-Hb] in the hand or foot representation area (left or medial somatosensory and primary motor cortex). Additionally an increase of [oxy-Hb] and a decrease of [deoxy-Hb] in the medial area of the anterior prefrontal cortex (APFC) during the inhibition of finger/foot movements were found. The results showed, that inhibition/execution of learned motor programs depends on an interplay of focal increases and decreases of neural activity in prefrontal and sensorimotor areas regardless of the effector. As far as we know, this is the first study investigating inhibitory processes of finger/foot movements by means of multi-channel fNIRS.
Keywords: PFC; anterior prefrontal cortex (APFC); fNIRS; motor cortex; motor learning; response inhibition.
Figures


Similar articles
-
Upper limb intelligent feedback robot training significantly activates the cerebral cortex and promotes the functional connectivity of the cerebral cortex in patients with stroke: A functional near-infrared spectroscopy study.Front Neurol. 2023 Feb 6;14:1042254. doi: 10.3389/fneur.2023.1042254. eCollection 2023. Front Neurol. 2023. PMID: 36814999 Free PMC article.
-
Language-activated cerebral blood oxygenation and hemodynamic changes of the left prefrontal cortex in poststroke aphasic patients: a near-infrared spectroscopy study.Stroke. 1998 Jul;29(7):1299-304. doi: 10.1161/01.str.29.7.1299. Stroke. 1998. PMID: 9660376
-
A semi-immersive virtual reality incremental swing balance task activates prefrontal cortex: a functional near-infrared spectroscopy study.Neuroimage. 2014 Jan 15;85 Pt 1:451-60. doi: 10.1016/j.neuroimage.2013.05.031. Epub 2013 May 17. Neuroimage. 2014. PMID: 23684867
-
Integrated technology for evaluation of brain function and neural plasticity.Phys Med Rehabil Clin N Am. 2004 Feb;15(1):263-306. doi: 10.1016/s1047-9651(03)00124-4. Phys Med Rehabil Clin N Am. 2004. PMID: 15029909 Review.
-
Comparison of blood-oxygen-level-dependent functional magnetic resonance imaging and near-infrared spectroscopy recording during functional brain activation in patients with stroke and brain tumors.J Biomed Opt. 2007 Nov-Dec;12(6):062110. doi: 10.1117/1.2823036. J Biomed Opt. 2007. PMID: 18163813 Review.
Cited by
-
A Functional Near-Infrared Spectroscopy Examination of the Neural Correlates of Mental Rotation for Individuals With Different Depressive Tendencies.Front Hum Neurosci. 2022 Feb 7;16:760738. doi: 10.3389/fnhum.2022.760738. eCollection 2022. Front Hum Neurosci. 2022. PMID: 35197834 Free PMC article.
-
Volitional inhibition and brain-machine interfaces: a mandatory wedding.Front Neuroeng. 2012 Aug 28;5:20. doi: 10.3389/fneng.2012.00020. eCollection 2012. Front Neuroeng. 2012. PMID: 22973225 Free PMC article. No abstract available.
-
Microstructural Properties of Human Brain Revealed by Fractional Anisotropy Can Predict the After-Effect of Intermittent Theta Burst Stimulation.Cereb Cortex Commun. 2021 Dec 15;3(1):tgab065. doi: 10.1093/texcom/tgab065. eCollection 2022. Cereb Cortex Commun. 2021. PMID: 35083435 Free PMC article.
-
Prefrontal Cortex Activation Upon a Demanding Virtual Hand-Controlled Task: A New Frontier for Neuroergonomics.Front Hum Neurosci. 2016 Feb 16;10:53. doi: 10.3389/fnhum.2016.00053. eCollection 2016. Front Hum Neurosci. 2016. PMID: 26909033 Free PMC article.
-
Altered prefrontal activation during the inhibition of eating responses in women with bulimia nervosa.Psychol Med. 2023 Jun;53(8):3580-3590. doi: 10.1017/S0033291722000198. Epub 2022 Feb 25. Psychol Med. 2023. PMID: 35209961 Free PMC article.
References
LinkOut - more resources
Full Text Sources
Research Materials
Miscellaneous

