Metabolic syndrome induces changes in KATP-channels and calcium currents in pancreatic β-cells
- PMID: 22885660
- PMCID: PMC3496655
- DOI: 10.4161/isl.21374
Metabolic syndrome induces changes in KATP-channels and calcium currents in pancreatic β-cells
Abstract
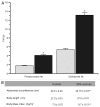
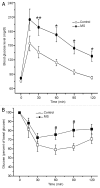
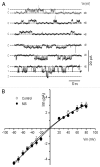
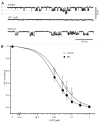
Metabolic syndrome (MS) can be defined as a group of signs that increases the risk of developing type 2 diabetes mellitus (DM2). These signs include obesity, hyperinsulinemia and insulin resistance. We are interested in the mechanisms that trigger hyperinsulinemia as a step to understand how β cells fail in DM2. Pancreatic β cells secrete insulin in response to glucose variations in the extracellular medium. When they are chronically over-stimulated, hyperinsulinemia is observed; but then, with time, they become incapable of maintaining normal glucose levels, giving rise to DM2. A chronic high sucrose diet for two months induces MS in adult male Wistar rats. In the present article, we analyzed the effect of the internal environment of rats with MS, on the activity of ATP-sensitive potassium channels (KATP) and calcium currents of pancreatic β cells. After 24 weeks of treatment with 20% sucrose in their drinking water, rats showed central obesity, hyperinsulinemia and insulin resistance, and their systolic blood pressure and triglycerides plasma levels increased. These signs indicate the onset of MS. KATP channels in isolated patches of β cells from MS rats, had an increased sensitivity to ATP with respect to controls. Moreover, the macroscopic calcium currents, show increased variability compared with cells from control individuals. These results demonstrate that regardless of genetic background, a high sucrose diet leads to the development of MS. The observed changes in ionic channels can partially explain the increase in insulin secretion in MS rats. However, some β cells showed smaller calcium currents. These cells may represent a β cell subpopulation as it becomes exhausted by the long-term high sucrose diet.
Figures


Similar articles
-
Early Effects of Metabolic Syndrome on ATP-Sensitive Potassium Channels from Rat Pancreatic Beta Cells.Metabolites. 2022 Apr 18;12(4):365. doi: 10.3390/metabo12040365. Metabolites. 2022. PMID: 35448552 Free PMC article.
-
Metabolic syndrome and ionic channels in pancreatic beta cells.Vitam Horm. 2014;95:87-114. doi: 10.1016/B978-0-12-800174-5.00004-1. Vitam Horm. 2014. PMID: 24559915 Review.
-
GW9508 inhibits insulin secretion by activating ATP-sensitive potassium channels in rat pancreatic β-cells.J Mol Endocrinol. 2013 Jun 1;51(1):69-77. doi: 10.1530/JME-13-0019. Print 2013. J Mol Endocrinol. 2013. PMID: 23628491
-
Early endocrine and molecular changes in metabolic syndrome models.IUBMB Life. 2011 Oct;63(10):831-9. doi: 10.1002/iub.544. Epub 2011 Sep 9. IUBMB Life. 2011. PMID: 21905198 Review.
-
Impaired glucose-stimulated insulin secretion and reduced β-cell mass in pancreatic islets of hyperthyroid rats.Exp Physiol. 2016 Aug 1;101(8):1114-27. doi: 10.1113/EP085627. Epub 2016 Jun 27. Exp Physiol. 2016. PMID: 27060234
Cited by
-
Bone Remodeling and Energy Metabolism: New Perspectives.Bone Res. 2013 Mar 29;1(1):72-84. doi: 10.4248/BR201301005. eCollection 2013 Mar. Bone Res. 2013. PMID: 26273493 Free PMC article. Review.
-
Increased anxiety-like behavior is associated with the metabolic syndrome in non-stressed rats.PLoS One. 2017 May 2;12(5):e0176554. doi: 10.1371/journal.pone.0176554. eCollection 2017. PLoS One. 2017. PMID: 28463967 Free PMC article.
-
High sugar consumption for seven days in adult mice increased blood glucose variability, induced an anxiolytic effect and triggered oxidative stress in cerebral cortex.Metab Brain Dis. 2024 Jun;39(5):731-739. doi: 10.1007/s11011-024-01352-5. Epub 2024 May 9. Metab Brain Dis. 2024. PMID: 38720093
-
Sexual dimorphism in insulin resistance in a metabolic syndrome rat model.Endocr Connect. 2020 Sep;9(9):890-902. doi: 10.1530/EC-20-0288. Endocr Connect. 2020. PMID: 33069157 Free PMC article.
-
Early Effects of Metabolic Syndrome on ATP-Sensitive Potassium Channels from Rat Pancreatic Beta Cells.Metabolites. 2022 Apr 18;12(4):365. doi: 10.3390/metabo12040365. Metabolites. 2022. PMID: 35448552 Free PMC article.
References
-
- Chew GT, Gan SK, Watts GF. Revisiting the metabolic syndrome. Med J Aust. 2006;185:445–9. - PubMed
Publication types
MeSH terms
Substances
LinkOut - more resources
Full Text Sources
Medical
