Spatial organization of the chicken beta-globin gene domain in erythroid cells of embryonic and adult lineages
- PMID: 22958419
- PMCID: PMC3502096
- DOI: 10.1186/1756-8935-5-16
Spatial organization of the chicken beta-globin gene domain in erythroid cells of embryonic and adult lineages
Abstract
Background: The β-globin gene domains of vertebrate animals constitute popular models for studying the regulation of eukaryotic gene transcription. It has previously been shown that in the mouse the developmental switching of globin gene expression correlates with the reconfiguration of an active chromatin hub (ACH), a complex of promoters of transcribed genes with distant regulatory elements. Although it is likely that observations made in the mouse β-globin gene domain are also relevant for this locus in other species, the validity of this supposition still lacks direct experimental evidence. Here, we have studied the spatial organization of the chicken β-globin gene domain. This domain is of particular interest because it represents the perfect example of the so-called 'strong' tissue-specific gene domain flanked by insulators, which delimit the area of preferential sensitivity to DNase I in erythroid cells.
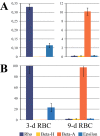
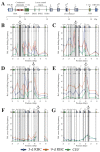
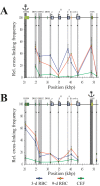
Results: Using chromosome conformation capture (3C), we have compared the spatial configuration of the β-globin gene domain in chicken red blood cells (RBCs) expressing embryonic (3-day-old RBCs) and adult (9-day-old RBCs) β-globin genes. In contrast to observations made in the mouse model, we found that in the chicken, the early embryonic β-globin gene, Ε, did not interact with the locus control region in RBCs of embryonic lineage (3-day RBCs), where this gene is actively transcribed. In contrast to the mouse model, a strong interaction of the promoter of another embryonic β-globin gene, ρ, with the promoter of the adult β-globin gene, βA, was observed in RBCs from both 3-day and 9-day chicken embryos. Finally, we have demonstrated that insulators flanking the chicken β-globin gene domain from the upstream and from the downstream interact with each other, which places the area characterized by lineage-specific sensitivity to DNase I in a separate chromatin loop.
Conclusions: Taken together, our results strongly support the ACH model but show that within a domain of tissue-specific genes, the active status of a promoter does not necessarily correlate with the recruitment of this promoter to the ACH.
Figures


Similar articles
-
The inactivation of the π gene in chicken erythroblasts of adult lineage is not mediated by packaging of the embryonic part of the α-globin gene domain into a repressive heterochromatin-like structure.Epigenetics. 2011 Dec;6(12):1481-8. doi: 10.4161/epi.6.12.18215. Epigenetics. 2011. PMID: 22139578
-
Study of spatial organization of chicken alpha-globin gene domain by 3C technique.Biochemistry (Mosc). 2008 Nov;73(11):1192-9. doi: 10.1134/s0006297908110047. Biochemistry (Mosc). 2008. PMID: 19120022
-
Spatial configuration of the chicken alpha-globin gene domain: immature and active chromatin hubs.Nucleic Acids Res. 2008 Aug;36(14):4629-40. doi: 10.1093/nar/gkn429. Epub 2008 Jul 11. Nucleic Acids Res. 2008. PMID: 18621783 Free PMC article.
-
Mechanisms controlling activation of the alpha-globin gene domain in chicken erythroid cells.Biochemistry (Mosc). 2007 May;72(5):467-70. doi: 10.1134/s000629790705001x. Biochemistry (Mosc). 2007. PMID: 17573699 Review.
-
Structural organization of the alpha and beta globin loci of the goat.Prog Clin Biol Res. 1985;191:67-79. Prog Clin Biol Res. 1985. PMID: 3901040 Review.
Cited by
-
The clustering of CpG islands may constitute an important determinant of the 3D organization of interphase chromosomes.Epigenetics. 2014 Jul;9(7):951-63. doi: 10.4161/epi.28794. Epub 2014 Apr 15. Epigenetics. 2014. PMID: 24736527 Free PMC article.
-
Chicken Erythrocyte: Epigenomic Regulation of Gene Activity.Int J Mol Sci. 2023 May 5;24(9):8287. doi: 10.3390/ijms24098287. Int J Mol Sci. 2023. PMID: 37175991 Free PMC article. Review.
-
Characterization of the enhancer element of the Danio rerio minor globin gene locus.Histochem Cell Biol. 2016 Apr;145(4):463-73. doi: 10.1007/s00418-016-1413-z. Epub 2016 Feb 4. Histochem Cell Biol. 2016. PMID: 26847176
-
3D genomics imposes evolution of the domain model of eukaryotic genome organization.Chromosoma. 2017 Feb;126(1):59-69. doi: 10.1007/s00412-016-0604-7. Epub 2016 Jun 10. Chromosoma. 2017. PMID: 27286720 Review.
-
Co-Regulated Genes and Gene Clusters.Genes (Basel). 2021 Jun 11;12(6):907. doi: 10.3390/genes12060907. Genes (Basel). 2021. PMID: 34208174 Free PMC article. Review.
References
-
- Guerrero G, Delgado-Olguin P, Escamilla-Del-Arenal M, Furlan-Magaril M, Rebollar E, De La Rosa-Velazquez IA, Soto-Reyes E, Rincon-Arano H, Valdes-Quezada C, Valadez-Graham V, Recillas-Targa F. Globin genes transcriptional switching, chromatin structure and linked lessons to epigenetics in cancer: a comparative overview. Comp Biochem Physiol A Mol Integr Physiol. 2007;147:750–760. doi: 10.1016/j.cbpa.2006.10.037. - DOI - PubMed
LinkOut - more resources
Full Text Sources

