. 2012 Oct 30;109(44):E2998-3007.
doi: 10.1073/pnas.1215899109. Epub 2012 Oct 8.

Transposon mutagenesis identifies genes that transform neural stem cells into glioma-initiating cells

Affiliations

Transposon mutagenesis identifies genes that transform neural stem cells into glioma-initiating cells

Hideto Koso et al. Proc Natl Acad Sci U S A. .

Abstract

Neural stem cells (NSCs) are considered to be the cell of origin of glioblastoma multiforme (GBM). However, the genetic alterations that transform NSCs into glioma-initiating cells remain elusive. Using a unique transposon mutagenesis strategy that mutagenizes NSCs in culture, followed by additional rounds of mutagenesis to generate tumors in vivo, we have identified genes and signaling pathways that can transform NSCs into glioma-initiating cells. Mobilization of Sleeping Beauty transposons in NSCs induced the immortalization of astroglial-like cells, which were then able to generate tumors with characteristics of the mesenchymal subtype of GBM on transplantation, consistent with a potential astroglial origin for mesenchymal GBM. Sequence analysis of transposon insertion sites from tumors and immortalized cells identified more than 200 frequently mutated genes, including human GBM-associated genes, such as Met and Nf1, and made it possible to discriminate between genes that function during astroglial immortalization vs. later stages of tumor development. We also functionally validated five GBM candidate genes using a previously undescribed high-throughput method. Finally, we show that even clonally related tumors derived from the same immortalized line have acquired distinct combinations of genetic alterations during tumor development, suggesting that tumor formation in this model system involves competition among genetically variant cells, which is similar to the Darwinian evolutionary processes now thought to generate many human cancers. This mutagenesis strategy is faster and simpler than conventional transposon screens and can potentially be applied to any tissue stem/progenitor cells that can be grown and differentiated in vitro.


Conflict of interest statement

The authors declare no conflict of interest.

Figures
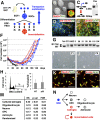
Fig. 1.
Fig. 1.
Transposon mutagenesis in NSCs promotes the immortalization of astroglial-like cells. (A) Mutagenesis strategy. NSCs isolated from the SVZ of mice with active SB transposition were expanded in vitro and induced to differentiate to select for immortalized cells. (B) Nestin+ and Sox2+ NSCs were expanded as neurospheres. (Magnification: 400×.) (C) Transposon excision from the transposon concatamer could be detected in neurospheres containing a nestin-cre allele by the presence of a 225-bp fragment. NSCs that were induced to differentiate stained positive for neuronal (βIII tubulin) and oligodendrocytic (O4) markers (D), as well as for astrocytic (GFAP and S-100β) markers (E). The nucleus is counterstained with DAPI. (Scale bars: 100 μm.) (F) Growth during serial passage of three Nes-cre/+; T2/Onc2,3/+; SBase/+ (red) and three p53R172H/+; Nes-cre/+; T2/Onc2,3/+; SBase/+ (blue) lines. Three additional lines in which the cells entered senescence are also shown (black). (G) PCR-based detection of WT and mutant p53 alleles. In nestin-cre transgenic animals, expression of the p53R172H mutant allele is induced in the cortex (CTX) and neurospheres (NSC) but not in the tail. The p53 WT allele is not expressed in six immortalized lines harboring a p53R172H mutant allele but is expressed in a cell line overexpressing p53DN (DN). (H) Fractions of cells with increased DNA content (%) were compared between p53 mutant (n = 5) and WT (n = 3) immortalized lines (Fig. S1A). Differentiating cells exhibit flat and polygonal morphology at passage 1 (I) but become spindle-shaped when immortalized at passage 9 (J). Immortalized lines expressed NSC markers (K; nestin and Sox2) and astrocyte markers (L; GFAP and S-100β). (Scale bars: 100 μm.) (M) GSEA enrichment score (ES) was calculated for 10 immortalized lines against control samples using five gene sets specific for neuron, oligodendrocyte, OPC, astrocyte, and cultured astroglia (19). Randomly selected gene sets were used as a control. The P value (p-val) and false discovery rate (FDR) are also shown for each gene set. (N) Schematic diagram of differentiation of NSCs into neuronal, oligodendrocytic, and astrocytic lineages.
Fig. 2.
Fig. 2.
Southern blot analysis of transposon insertion sites in immortalized lines and tumors. (A) Genomic DNA isolated from eight immortalized lines was digested with BamHI and hybridized with a probe specific for the transposon. Each cell line shows a distinct pattern of transposon insertions. DN, a cell line overexpressing p53DN. (B) Southern blot analysis of the transposon insertion sites in six subcloned lines derived from line 3. (C) Seven tumors derived from cell line 31 all show unique patterns of insertions that are distinct from the transplanted cells. A strong signal is observed for the transposon concatamer (Onc2) in DNA isolated from mice that harbor the transposon concatamer but lack active SB transposase.
Fig. 5.
Fig. 5.
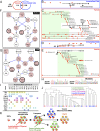
Genes and signaling pathways mutated in tumors and immortalized lines. (A) Overlap between genes mutated in tumors and immortalized lines. Five Met insertions were identified in 5 immortalized lines (B), whereas 60 Met insertions were identified in 22 tumors (C). Transposon insertions are located in the sense (solid red arrows) or antisense (open red arrows) orientation relative to Met transcription. (C) Patterns of Met insertions are shown for individual tumor samples. The number of insertions is indicated in parentheses for each tumor. Eighteen Nf1 insertions were identified in 10 immortalized lines (D), whereas 35 Nf1 insertions were identified in 19 tumors (E). Gene networks generated by IPA analysis are combined and illustrated for 10 tumor CIS genes (F) and 11 CIS genes from immortalized cells (G). Mutation frequencies are shown for each CIS gene (red). CIS genes found in both tumors and cell lines are thick-framed. (H) SB footprint was detected at the Zfp326 locus in a tumor derived from an immortalized line with the Zfp326 insertion (line 95) but not in a normal allele. (I) Combinations of RTK pathway genes were examined for tumors derived from line 31. The number of insertions in each tumor is shown in boxes. (J) Hierarchical clustering based on the Hamming distance was performed for 40 tumors derived from 5 cell lines with the same genotype (p53R172H/+; Nes-cre/+; T2/Onc2/+; SBase/+). The similarity of patterns of CIS genes among different samples is represented by vertical distance. (K) Model for transposon-induced tumor development. Immortalization CIS genes (e.g., Gli3, Nf1) promote immortalization of NSCs. Immortalized astroglial-like cells have a large repertoire of insertions represented by different colors. Transposons are continuously jumping after transplantation, and transplanted cells become cancer-initiating cells (green) by randomly acquiring new insertions in tumor CIS genes (e.g., Met, Pdgfrb, Gab1) and clonally expand to form tumors. Several immortalization CIS genes are lost during tumor formation by continuous mobilization of transposons.
Fig. 3.
Fig. 3.
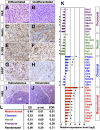
Tumors have characteristics of the mesenchymal subtype of GBM. Differentiated and undifferentiated lesions are stained with H&E (A and B) or immunostained with nestin (C and D), S-100β (E and F), or GFAP (G and H). (Scale bars: 50 μm.) (I) Differentiated lesion (D) locates adjacent to an undifferentiated lesion (UD). (J) Intracranial injection of tumorigenic cells generated a tumor (T) in brain parenchyma (P). (Scale bars: 50 μm.) (K) Expression levels of genes specific to the four subtypes of GBM (5) were examined for 12 tumors and compared with normal s.c. tissues. The relative gene expression level (log2 value of fold change) is shown for each gene. The asterisks indicate a difference from control (*P < 0.05, Student t test). (L) GSEA enrichment score (ES) was calculated for 12 tumors against control samples using the four gene sets specific to mesenchymal, classical, neuronal, and proneural subtypes of GBM (5). Randomly selected gene sets were used as a control. The P value (p-val) and false discovery rate (FDR) are also shown for each gene set.
Fig. 4.
Fig. 4.
Top 20 CIS genes for tumors and immortalized lines. (A) Top 20 CIS genes for tumors (Dataset S3). (B) Top 20 CIS genes for immortalized lines (Dataset S4). Chr, chromosome. *P value (P-val) was determined as previously described (21). Numbers of insertions at each CIS were compared between tumors and immortalized cells using Fisher’s exact test.
Fig. P1.
Fig. P1.
Transformation of NSCs into cancer-initiating cells for mesenchymal GBM. Immortalization-CIS genes (e.g., Gli3, Nf1) promote immortalization of NSCs. Immortalized astroglial cells show a large repertoire of insertions represented by different colors. Transposons are continuously jumping to other sites in the genome after transplantation, and transplanted cells become cancer-initiating cells by randomly acquiring new insertions in tumor CIS genes (e.g., Met, Pdgfrb, Gab1) and then clonally expand to form tumors with characteristics of mesenchymal GBM. Each tumor showed a distinct combination of CIS genes even though all tumors were derived from a single line. Most of the immortalization CIS genes, with the exception of 34 genes, are lost during tumor formation. The 114 tumor CIS genes were newly acquired during tumor development. These gene sets are enriched in processes associated with distinct signaling pathways.

Similar articles

Cited by

References

    1. Ohgaki H, Kleihues P. Epidemiology and etiology of gliomas. Acta Neuropathol. 2005;109(1):93–108. - PubMed
    1. Singh SK, et al. Identification of human brain tumour initiating cells. Nature. 2004;432(7015):396–401. - PubMed
    1. Reya T, Morrison SJ, Clarke MF, Weissman IL. Stem cells, cancer, and cancer stem cells. Nature. 2001;414(6859):105–111. - PubMed
    1. Cancer Genome Atlas Research Network Comprehensive genomic characterization defines human glioblastoma genes and core pathways. Nature. 2008;455(7216):1061–1068. - PMC - PubMed
    1. Verhaak RG, et al. Cancer Genome Atlas Research Network Integrated genomic analysis identifies clinically relevant subtypes of glioblastoma characterized by abnormalities in PDGFRA, IDH1, EGFR, and NF1. Cancer Cell. 2010;17(1):98–110. - PMC - PubMed

Substances

Associated data

  NODES
chat 1
Project 1
twitter 2