. 2012 Dec 28;287(53):44234-48.
doi: 10.1074/jbc.M112.364109. Epub 2012 Nov 16.

The cannabinoid receptor CB1 modulates the signaling properties of the lysophosphatidylinositol receptor GPR55

Affiliations

The cannabinoid receptor CB1 modulates the signaling properties of the lysophosphatidylinositol receptor GPR55

Julia Kargl et al. J Biol Chem. .

Abstract

The G protein-coupled receptor (GPCR) 55 (GPR55) and the cannabinoid receptor 1 (CB1R) are co-expressed in many tissues, predominantly in the central nervous system. Seven transmembrane spanning (7TM) receptors/GPCRs can form homo- and heteromers and initiate distinct signaling pathways. Recently, several synthetic CB1 receptor inverse agonists/antagonists, such as SR141716A, AM251, and AM281, were reported to activate GPR55. Of these, SR141716A was marketed as a promising anti-obesity drug, but was withdrawn from the market because of severe side effects. Here, we tested whether GPR55 and CB1 receptors are capable of (i) forming heteromers and (ii) whether such heteromers could exhibit novel signaling patterns. We show that GPR55 and CB1 receptors alter each others signaling properties in human embryonic kidney (HEK293) cells. We demonstrate that the co-expression of FLAG-CB1 receptors in cells stably expressing HA-GPR55 specifically inhibits GPR55-mediated transcription factor activation, such as nuclear factor of activated T-cells and serum response element, as well as extracellular signal-regulated kinases (ERK1/2) activation. GPR55 and CB1 receptors can form heteromers, but the internalization of both receptors is not affected. In addition, we observe that the presence of GPR55 enhances CB1R-mediated ERK1/2 and nuclear factor of activated T-cell activation. Our data provide the first evidence that GPR55 can form heteromers with another 7TM/GPCR and that this interaction with the CB1 receptor has functional consequences in vitro. The GPR55-CB1R heteromer may play an important physiological and/or pathophysiological role in tissues endogenously co-expressing both receptors.


Figures
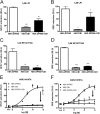
FIGURE 1.
FIGURE 1.
The CB1 receptor modulates GPR55 transcription factor activation in HEK-GPR55+CB1 cells. HEK-GPR55, HEK-CB1, and HEK-GPR55+CB1 cells were transfected with NFAT (A, C, and E) or SRE (B, D, and F) transcription factor-luciferase-reporter plasmids. 24 h post-transfection, cells were stimulated with 1 μm LPI (A and B), 1 μm SR141716A (C and D), or with increasing concentrations of the selective GPR55 agonist GSK319197A (E and F) for 4 h in serum-free medium. NFAT activation (A, C, and E) and SRE induction (B, D, and F) was observed in HEK-GPR55 (white bars or ■), but not in HEK-CB1 (gray bars or ▴) cells. NFAT activation and SRE induction were reduced (A and B) or abolished (C–F) in HEK-GPR55+CB1 cells (black bars or ▾). Data are mean ± S.E. from one of four independent experiments performed in triplicates. Data were normalized and expressed as percent of maximum activation which was set as 100%, relative light units (RLU). *, p < 0.05; **, p < 0.01; ***, p < 0.001.
FIGURE 2.
FIGURE 2.
GSK319197A binds to GPR55, but not to the CB1 receptor. Competition binding experiments were performed with 1.25 nm [3H]SR141716A as a tracer on HEK293 (A), HEK-CB1 (B), HEK-GPR55 (C), and HEK-GPR55+CB1 (D) membranes in the presence of increasing concentrations of SR141716A (■) or GSK319197A (▴). Experiments were performed in duplicates, data are mean ± S.E.
FIGURE 3.
FIGURE 3.
Increasing CB1 receptor levels inhibit GPR55 transcription factor activation. HEK-GPR55 cells were transfected with NFAT (A and B) or SRE (C and D) transcription factor-luciferase-reporter plasmids and increasing amounts of either FLAG-CB1 pcDNA (A--D, left panels) or FLAG-CCR5 pcDNA (A–D, right panels). DNA content in each well was kept constant by co-transfecting with empty pcDNA vector. 48 h post-transfection, cells were stimulated with 1 μm GSK319197A (A and C) or 1 μm SR141716A (B and D) for 4 h in serum-free medium. NFAT activation (A and B) and SRE induction (C and D) were reduced in the presence of increasing amounts of CB1 receptor (A-D, left panels), but remained unaffected by increasing amounts of CCR5 receptor (A–D, right panels). Data are mean ± S.E. from one of three independent experiments performed in triplicates. Data were normalized and expressed as percent of maximum activation of control (white bars), which was set as 100%, RLU, *, p < 0.05; **, p < 0.01; ***, p < 0.001. In parallel, FLAG-CB1 (E) and FLAG-CCR5 (F) receptor expression levels were analyzed by SDS-PAGE and immunoblotted for the receptor FLAG epitope (upper panels, anti-FLAG) and β-actin as protein control (lower panels).
FIGURE 4.
FIGURE 4.
ERK1/2 phosphorylation state is altered in HEK-GPR55+CB1 cells. HEK-GPR55 (white bars), HEK-CB1 (gray bars), and HEK-GPR55+CB1 cells (black bars) were serum starved overnight and stimulated with vehicle, 2.5 μm WIN55,212-2 (A and B), 2.5 μm SR141716A (A and C), or 2.5 μm GSK319197A (A and D) for 25 min. Cell lysates were resolved on a 12% SDS gel followed by antibody staining. Control stimulation with vehicle shows baseline pERK1/2 levels in single and double expression cell lines and the corresponding total ERK levels (t-ERK) are presented below the phospho-ERK (pERK) bands (A). WIN55,212-2 (A and B) induces ERK1/2 phosphorylation in HEK-CB1 and HEK-GPR55+CB1, but not in HEK-GPR55 cells. pERK1/2 levels were significantly increased in HEK-GPR55+CB1 cells compared with HEK-CB1 cells. The stimulation with 2.5 μm SR141716A (A and C) or 2.5 μm GSK319197A (A and D) mediates ERK1/2 phosphorylation in HEK-GPR55, but ERK1/2 phosphorylation is significantly reduced in HEK-GPR55+CB1 cells. A representative blot of three independent experiments is shown A. Blots show the mean ± S.E. from three independent experiments, whereby pERK1/2 bands were normalized to total ERK1/2 levels using densiometric analysis. *, p < 0.05; **, p < 0.01.
FIGURE 5.
FIGURE 5.
Combinatorial effects of CB1 and GPR55 ligands on ERK1/2 phosphorylation and NFAT activation in HEK-GPR55+CB1 cells. Immunoblots showing ERK1/2 phosphorylation in response to 2.5 μm WIN55,212-2 (A), 2.5 μm WIN55,212-2 + 2.5 μm GSK319197A (B), or 2.5 μm WIN55,212-2 + 2.5 μm SR141716A (C) in HEK-GPR55, HEK-CB1, and HEK-GPR55+CB1 cells. Individual stimulation with 2.5 μm WIN55,212-2 leads to ERK1/2 (A and D) and NFAT (G) activation in HEK-CB1 cells when compared with HEK-GPR55 cells, whereby the strongest activation was detected in HEK-GPR55+CB1 cells. Co-stimulation with 2.5 μm of each, WIN55,212-2 and GSK319197A (B, E, and H), elevates ERK1/2 phosphorylation and NFAT activation in all tested cell lines, whereby the strongest activation is seen in HEK-GPR55+CB1 cells. In contrast, ERK1/2 (C and F) and NFAT (I) activation was significantly reduced by co-stimulating HEK-CB1 and HEK-GPR55+CB1 cells with 2.5 μm WIN55,212-2 and 2.5 μm SR141716A, when compared with HEK-GPR55 cells. Representative blots from 3 independent experiments are shown (A, B, and C). pERK1/2 was normalized to total ERK1/2 and data are means of three independent experiments ± S.E. Reporter gene assay data are mean ± S.E. from one of three independent experiments performed in triplicates. Data were normalized and expressed as percent of maximum activation, which was set as 100%, *, p < 0.05; **, p < 0.01; ***, p < 0.001.
FIGURE 6.
FIGURE 6.
Combined administration of the endogenous CB1 agonist anandamide and GPR55 ligands restore GPR55-mediated ERK1/2 phosphorylation and NFAT activation in HEK-GPR55+CB1 cells. Representative immunoblot showing ERK1/2 phosphorylation in response to vehicle, 2.5 μm AEA, 2.5 μm AEA + 2.5 μm GSK319197A and 2.5 μm AEA + 2.5 μm SR141716A in HEK-GPR55, HEK-CB1, and HEK-GPR55+CB1 cells (A). Activation of ERK1/2 (A-D) and NFAT (E–G) were altered in HEK-GPR55, HEK-CB1, and HEK-GPR55+CB1 cells after individual stimulation with 2.5 μm AEA (A, B, and E) or co-stimulation with 2.5 μm AEA + 2.5 μm GSK319197A (A, C, and F) or 2.5 μm AEA + 2.5 μm SR141716A (A, D, and G). Stimulation with 2.5 μm AEA leads to a significantly higher level of ERK1/2 (A and B) and NFAT (E) activation in HEK-GPR55+CB1 compared with HEK-CB1 cells. No activation over baseline was observed in HEK-GPR55 cells. Increased ERK1/2 phosphorylation (A and C) and NFAT (F) activation occurred in all three cell lines after co-stimulation with 2.5 μm AEA and 2.5 μm GSK319197A. HEK-GPR55+CB1 cells show significantly higher activation levels compared with single cell lines. pERK1/2 (A and D) and NFAT (G) activation is inhibited by co-stimulation of HEK-CB1 and HEK-GPR55+CB1 cells with 2.5 μm AEA and 2.5 μm SR141716A, but induced in HEK-GPR55 cells. pERK1/2 was normalized to total ERK1/2 and data are means of three independent experiments ± S.E. Reporter gene assay data are mean ± S.E. from one of four independent experiments performed in triplicates. Data were normalized and expressed as percent of maximum activation, which was set as 100%, *, p < 0.05; **, p < 0.01; ***, p < 0.001.
FIGURE 7.
FIGURE 7.
CB1R-mediated Gαi activation is not responsible for the loss of GPR55 signal in HEK-GPR55+CB1 cells. HEK-GPR55 (A), HEK-CB1 (B), or HEK-GPR55+CB1 (C) cells were transfected with the NFAT transcription factor plasmid. 24 h post-transfection cells were preincubated for 4 h with either vehicle (□) or 100 ng/ml of PTX (■) and stimulated with increasing concentrations of GSK319197A. NFAT activation was not altered by PTX in HEK-GPR55 cells (A). No NFAT activation was measured in HEK-CB1 cells after stimulation with the GPR55 agonist GSK319197A (B). In HEK-GPR55+CB1 cells (C), NFAT signaling was impaired in PTX-treated cells (■) when compared with cells treated with vehicle (□). For ERK1/2 phosphorylation (D) determination in the presence or absence of PTX, HEK-GPR55, HEK-CB1, and HEK-GPR55+CB1 cells were serum starved overnight, preincubated with vehicle or 100 ng/ml of PTX for 4 h, and stimulated with vehicle or 2.5 μm GSK319197A for 25 min. ERK1/2 phosphorylation was not altered by PTX in HEK-GPR55 cells. No ERK1/2 activity was observed after vehicle treatment in all cell lines and stimulation with the GPR55 agonist GSK319197A in HEK-CB1 cells. HEK-GPR55+CB1 cells were preincubated with PTX showed decreased pERK1/2 when compared with vehicle preincubated double expressing cell line. Reporter gene assay data are mean ± S.E. from one of three independent experiments performed in duplicates. Data were normalized and expressed as percent of maximum activation, which was set as 100% (A–C). Representative ERK1/2 blot from three independent experiments is shown.
FIGURE 8.
FIGURE 8.
Overexpression of β-arrestin 2 does not restore GPR55-mediated signaling in HEK-GPR55+CB1 cells. HEK-GPR55 (A), HEK-CB1 (B), or HEK-GPR55+CB1 (C) cells were transfected with 100 ng of NFAT transcription factor plasmid and 100 ng of control pcDNA-GFP (□) or 100 ng of β-arrestin 2-GFP (■) plasmid. 48 h post-transfection cells were stimulated with increasing concentrations of GSK319197A. NFAT activation was not altered by β-arrestin 2 overexpression in HEK-GPR55 cells (A). No NFAT activation was detected in HEK-CB1 cells after stimulation with the GPR55 agonist GSK319197A (B). In HEK-GPR55+CB1 cells (C), NFAT signaling was not changed in β-arrestin 2-GFP cotransfected cells when compared with control pcDNA-GFP-transfected cells (□). Reporter gene assay data are mean ± S.E. from one of three independent experiments performed in triplicates. Data were normalized and expressed as percent of maximum activation, which was set as 100% (A–C). ERK1/2 phosphorylation was not altered by overexpression of β-arrestin 2 (D). ERK1/2 phosphorylation in the presence or absence of β-arrestin 2 was determined in HEK-GPR55, HEK-CB1, and HEK-GPR55+CB1 cells that were serum starved overnight. Cells were then stimulated with vehicle or 2.5 μm GSK319197A for 25 min. A representative ERK1/2 blot out of three independent experiments is shown. In parallel to reporter gene assays, overexpression of β-arrestin 2 was controlled by ELISA (E). ELISA data were normalized and are mean ± S.E.
FIGURE 9.
FIGURE 9.
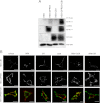
Co-immunoprecipitation and internalization of GPR55 and CB1R in HEK293 cells. HEK293, HEK-GPR55, HEK-CB1, and HEK-GPR55+CB1 cell lysates (A) were co-immunoprecipitated (IP) with anti-FLAG affinity matrix (IP) and immunoblotted (IB) for HA-GPR55 (1st panel). Lysates were probed for HA-GPR55 (2nd panel), FLAG-CB1 receptor (3rd panel), and β-actin (4th panel). GPR55 strongly interacts with CB1 receptors in the double expressing cell line. The blot is representative of three independent experiments. HEK-GPR55, HEK-CB1, and HEK-GPR55+CB1 cells were stimulated with 2.5 μm agonist for 45 min and receptor internalization was monitored (B). GPR55 and CB1 receptors are located on the cell surface without agonist treatment and internalize following agonist stimulation in single and double expressing cell lines. GPR55 and CB1 receptor interaction under unstimulated conditions does not alter receptor internalization. Scale bar = 20 μm.

Similar articles

Cited by

References

    1. Matsuda L. A., Lolait S. J., Brownstein M. J., Young A. C., Bonner T. I. (1990) Structure of a cannabinoid receptor and functional expression of the cloned cDNA. Nature 346, 561–564 - PubMed
    1. Munro S., Thomas K. L., Abu-Shaar M. (1993) Molecular characterization of a peripheral receptor for cannabinoids. Nature 365, 61–65 - PubMed
    1. Pertwee R. G., Howlett A. C., Abood M. E., Alexander S. P., Di Marzo V., Elphick M. R., Greasley P. J., Hansen H. S., Kunos G., Mackie K., Mechoulam R., Ross R. A. (2010) International Union of Basic and Clinical Pharmacology. LXXIX. Cannabinoid receptors and their ligands. Beyond CB1 and CB2. Pharmacol. Rev. 62, 588–631 - PMC - PubMed
    1. Tsou K., Brown S., Sañudo-Peña M. C., Mackie K., Walker J. M. (1998) Immunohistochemical distribution of cannabinoid CB1 receptors in the rat central nervous system. Neuroscience 83, 393–411 - PubMed
    1. Buckley N. E. (2008) The peripheral cannabinoid receptor knockout mice. An update. Br. J. Pharmacol. 153, 309–318 - PMC - PubMed

Publication types

MeSH terms

  NODES
admin 3
INTERN 8
twitter 2