. 2012:2012:989372.
doi: 10.1155/2012/989372. Epub 2012 Nov 11.

Group VIB Phospholipase A(2) promotes proliferation of INS-1 insulinoma cells and attenuates lipid peroxidation and apoptosis induced by inflammatory cytokines and oxidant agents

Affiliations

Group VIB Phospholipase A(2) promotes proliferation of INS-1 insulinoma cells and attenuates lipid peroxidation and apoptosis induced by inflammatory cytokines and oxidant agents

Shunzhong Bao et al. Oxid Med Cell Longev. 2012.

Abstract

Group VIB Phospholipase A(2) (iPLA(2)γ) is distributed in membranous organelles in which β-oxidation occurs, that is, mitochondria and peroxisomes, and is expressed by insulin-secreting pancreatic islet β-cells and INS-1 insulinoma cells, which can be injured by inflammatory cytokines, for example, IL-1β and IFN-γ, and by oxidants, for example, streptozotocin (STZ) or t-butyl-hydroperoxide (TBHP), via processes pertinent to mechanisms of β-cell loss in types 1 and 2 diabetes mellitus. We find that incubating INS-1 cells with IL-1β and IFN-γ, with STZ, or with TBHP causes increased expression of iPLA(2)γ mRNA and protein. We prepared INS-1 knockdown (KD) cell lines with reduced iPLA(2)γ expression, and they proliferate more slowly than control INS-1 cells and undergo increased membrane peroxidation in response to cytokines or oxidants. Accumulation of oxidized phospholipid molecular species in STZ-treated INS-1 cells was demonstrated by LC/MS/MS scanning, and the levels in iPLA(2)γ-KD cells exceeded those in control cells. iPLA(2)γ-KD INS-1 cells also exhibited higher levels of apoptosis than control cells when incubated with STZ or with IL-1β and IFN-γ. These findings suggest that iPLA(2)γ promotes β-cell proliferation and that its expression is increased during inflammation or oxidative stress as a mechanism to mitigate membrane injury that may enhance β-cell survival.


Figures
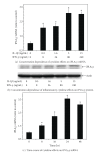
Figure 1
Figure 1
Influence of the inflammatory cytokines interleukin-1β (IL-1β) and interferon-γ (IFN-γ) on iPLA 2 γ expression by INS-1 cells. Control INS-1 cells were incubated with vehicle alone or with various concentrations of IL-1β and IFN-γ for 16 hr, and iPLA2 γ mRNA levels were then determined by quantitative PCR (panel (a)) and iPLA2 γ protein levels by Western blotting (panel (b)), as described in Experimental Procedures. In panel (c), control INS-1 cells were incubated with IL-1β (5 ng/mL) and IFN-γ (80 ng/mL) for various intervals (0, 8, 16, 24, and 48 hr), at the end of which iPLA2 γ mRNA levels were determined by quantitative PCR. In panels (a) and (c), mean values ± SEM (n = 4) are displayed, and an asterisk (*) indicates a significant difference (P < 0.05) from the condition in which the concentration (panel (a)) or time (panel (b)) parameter value was zero. The immunoblot in panel (b) is representative of four experiments.
Figure 2
Figure 2
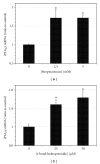
Influence of the oxidant agents streptozotocin (STZ) and tert-butylhydroperoxide (TBHP) on iPLA 2 γ expression by INS-1 cells. Control INS-1 cells were incubated with various concentrations of STZ (panel (a)) or TBHP (panel (b)) for 16 hr, and iPLA2 γ mRNA levels were then determined by quantitative PCR, as in Figure 1(a). Mean values ± SEM (n = 4) are displayed, and an asterisk (*) indicates a significant difference (P < 0.05) from the condition in which the concentration of the oxidant agent was zero.
Figure 3
Figure 3
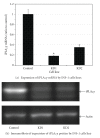
Establishing iPLA 2 γ-knockdown INS-1 cell lines. INS-1 cells were transfected with FIV constructs containing inserts that produced either scrambled RNA (control) or siRNA directed against sequences in iPLA2 γ mRNA (KD1, KD2). The relative iPLA2 γ expression levels in control INS-1 cells and in the iPLA2 γ-knockdown (KD) cell lines KD1 and KD2 were assessed by quantitative PCR for mRNA (panel (a)) and by Western blotting analysis for iPLA2 γ-immunoreactive protein (panel (b)). In panel (a), mean values ± SEM are displayed (n = 4). An asterisk (*) denotes a significant difference (P < 0.05) from the value for control INS-1 cells. The immunoblot in panel (b) is representative of four experiments.
Figure 4
Figure 4
Proliferation rates of INS-1 cell lines. Control INS-1 cells (open circles) or the iPLA2 γ-Knockdown cell lines KD1 (closed circles) or KD2 (closed triangles) were seeded onto the wells of microtiter plates (density 3 × 10³ cells/well) and incubated for various intervals (24, 48, or 72 hr), at the end of which cell number was estimated based on DNA content by using a fluorescent indicator as described in Experimental Procedures. Mean values ± SEM are displayed (n = 4). An asterisk (*) denotes a significant difference (P < 0.05) from the value for the control INS-1 cell line at the indicated time point.
Figure 5
Figure 5
Influence of inflammatory cytokines and oxidant agents on lipid peroxidation of INS-1 Cell Lines. Control INS-1 cells (light bars) or iPLA2 γ-Knockdown INS-1 cells (dark bars) were incubated with vehicle only or with the combination of IL-1β (5 ng/mL) and IFN-γ (80 ng/mL) or with STZ (5 mM) or TBHP (50 μM) for 16 hr, and lipid peroxidation was then determined by the TBARS assay, as described in Experimental Procedures. Mean values ± SEM (n = 4) are displayed, and an asterisk (*) indicates a significant difference (P < 0.05) from control INS-1 cells. An (X) indicates a significant difference (P < 0.05) from the vehicle-treated condition.
Figure 6
Figure 6
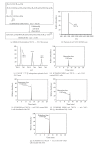
HPLC-ESI-MS/MS analysis of oxidized lipid molecular species that accumulate in INS-1 cells incubated with streptozotocin. Control INS-1 cells (light bars) or iPLA2 γ-knockdown INS-1 cells (dark bars) were incubated with vehicle only or with STZ (5 mM) for 16 hr as in Figure 5, and lipids were then extracted and analyzed by HPLC-LC-MS/MS as described in Experimental Procedures. Panel (a) illustrates the MS/MS transition monitored, which is the production of the hydroxyeicosatetraenoate (HETE) [M-H] ion (m/z 319.3) from the parent (C18:0/C20:4)-GPE [M-H] ion (m/z 782.76) upon collisionally activated dissociation. Prior survey scans monitoring parents of oxidized linoleate (C18:2) and docosahexaenoate (C22:6) species had revealed that HETE (HO-C20:4) was the dominant oxidized fatty acid residue esterified in INS-1 cell phospholipids. Panel (b) is an MS/MS scan over the m/z range 400–2000 in which parent ions that generate the HETE anion (m/z 319.3) are monitored, and m/z 782.76 is the vastly predominant parent, which was found to represent the (C18:0/C20:4)-GPE [M-H] ion upon analysis of the complete MS/MS spectrum/ Panel (c) is an expansion of that mass spectrum over the m/z range 782.5 to 785.0 to illustrate the [13C] isotopomer distribution of the [M-H] ion. In panels (d) and (e) represent HPLC/ESI/MS/MS scans in which the transition m/z 782.76 to m/z 319.3 is monitored as a function of LC retention time to quantitate the (C18:0/C20:4)-GPE content of control INS-1 cells (panels (d) and (e)) or iPLA2 γ-knockdown (KD) INS-1 cells (panels (f) and (g)) incubated without (panels (d) and (f)) or with STZ (panels (e) and (g)). Panel (h) represents a summary of four such experiments, and mean values are displayed and SEM indicated. An asterisk (*) denotes a significant (P < 0.05) difference between control and iPLA2 γ-KD INS-1 cell lines, and an X denotes a significant difference between cells incubated with or without STZ.
Figure 6
Figure 6
HPLC-ESI-MS/MS analysis of oxidized lipid molecular species that accumulate in INS-1 cells incubated with streptozotocin. Control INS-1 cells (light bars) or iPLA2 γ-knockdown INS-1 cells (dark bars) were incubated with vehicle only or with STZ (5 mM) for 16 hr as in Figure 5, and lipids were then extracted and analyzed by HPLC-LC-MS/MS as described in Experimental Procedures. Panel (a) illustrates the MS/MS transition monitored, which is the production of the hydroxyeicosatetraenoate (HETE) [M-H] ion (m/z 319.3) from the parent (C18:0/C20:4)-GPE [M-H] ion (m/z 782.76) upon collisionally activated dissociation. Prior survey scans monitoring parents of oxidized linoleate (C18:2) and docosahexaenoate (C22:6) species had revealed that HETE (HO-C20:4) was the dominant oxidized fatty acid residue esterified in INS-1 cell phospholipids. Panel (b) is an MS/MS scan over the m/z range 400–2000 in which parent ions that generate the HETE anion (m/z 319.3) are monitored, and m/z 782.76 is the vastly predominant parent, which was found to represent the (C18:0/C20:4)-GPE [M-H] ion upon analysis of the complete MS/MS spectrum/ Panel (c) is an expansion of that mass spectrum over the m/z range 782.5 to 785.0 to illustrate the [13C] isotopomer distribution of the [M-H] ion. In panels (d) and (e) represent HPLC/ESI/MS/MS scans in which the transition m/z 782.76 to m/z 319.3 is monitored as a function of LC retention time to quantitate the (C18:0/C20:4)-GPE content of control INS-1 cells (panels (d) and (e)) or iPLA2 γ-knockdown (KD) INS-1 cells (panels (f) and (g)) incubated without (panels (d) and (f)) or with STZ (panels (e) and (g)). Panel (h) represents a summary of four such experiments, and mean values are displayed and SEM indicated. An asterisk (*) denotes a significant (P < 0.05) difference between control and iPLA2 γ-KD INS-1 cell lines, and an X denotes a significant difference between cells incubated with or without STZ.
Figure 7
Figure 7
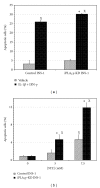
Influence of inflammatory cytokines and streptozotocin (STZ) on apoptosis of INS-1 cell lines. In panel (a), control INS-1 cells or iPLA2 γ-knockdown INS-1 cells (iPLA2-KD) were incubated with vehicle only (light bars) or with IL-1β (5 ng/mL) and IFN-γ (80 ng/mL) (dark bars) for 16 hr, and the percentages of apoptotic cells were then determined by FACS as described in Experimental Procedures. In panel (b), control INS-1 cells (light bars) or iPLA2 γ-Knockdown INS-1 cells (dark bars) were incubated with vehicle alone or with varied concentrations of STZ (5 mM or 7.5 mM) for 16 hr, and the percentages of apoptotic cells were then determined as in panel (a). Mean values ± SEM (n = 4) are displayed. An asterisk (*) indicates a significant difference (P < 0.05) between control cells and iPLA2 γ-KD cells. An (X) indicates a significant difference (P < 0.05) from the vehicle-treated condition.

Similar articles

Cited by

References

    1. Leahy JL. Pathogenesis of type 2 diabetes mellitus. Archives of Medical Research. 2005;36(3):197–209. - PubMed
    1. Mathis D, Vence L, Benoist C. β-cell death during progression to diabetes. Nature. 2001;414(6865):792–798. - PubMed
    1. Gepts W. Pathologic anatomy of the pancreas in juvenile diabetes mellitus. Diabetes. 1965;14(10):619–633. - PubMed
    1. Mandrup-Poulsen T. The role of interleukin-1 in the pathogenesis of IDDM. Diabetologia. 1996;39(9):1005–1029. - PubMed
    1. Rabinovitch A, Suarez-Pinzon WL. Cytokines and their roles in pancreatic islet β-cell destruction and insulin-dependent diabetes mellitus. Biochemical Pharmacology. 1998;55(8):1139–1149. - PubMed

Publication types

MeSH terms

LinkOut - more resources

  NODES
Note 6
twitter 2