Changes in the expression patterns of the genes involved in the segregation and function of inner cell mass and trophectoderm lineages during porcine preimplantation development
- PMID: 23257836
- PMCID: PMC3934199
- DOI: 10.1262/jrd.2012-122
Changes in the expression patterns of the genes involved in the segregation and function of inner cell mass and trophectoderm lineages during porcine preimplantation development
Abstract
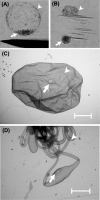
In mouse embryos, segregation of the inner cell mass (ICM) and trophectoderm (TE) lineages is regulated by genes, such as OCT-4, CDX2 and TEAD4. However, the molecular mechanisms that regulate the segregation of the ICM and TE lineages in porcine embryos remain unknown. To obtain insights regarding the segregation of the ICM and TE lineages in porcine embryos, we examined the mRNA expression patterns of candidate genes, OCT-4, CDX2, TEAD4, GATA3, NANOG, FGF4, FGFR1-IIIc and FGFR2-IIIc, in blastocyst and elongated stage embryos. In blastocyst embryos, the expression levels of OCT-4, FGF4 and FGFR1-IIIc were significantly higher in the ICM than in the TE, while the CDX2, TEAD4 and GATA3 levels did not differ between the ICM and TE. The expression ratio of CDX2 to OCT-4 (CDX2/OCT-4) also did not differ between the ICM and TE at the blastocyst stage. In elongated embryos, OCT-4, NANOG, FGF4 and FGFR1-IIIc were abundantly expressed in the embryo disc (ED; ICM lineage), but their expression levels were very low in the TE. In contrast, the CDX2, TEAD4 and GATA3 levels were significantly higher in the TE than in the ED. In addition, the CDX2/OCT-4 ratio was markedly higher in the TE than in the ED. We demonstrated that differences in the expression levels of OCT-4, CDX2, TEAD4, GATA3, NANOG, FGF4, FGFR1-IIIc and FGFR2-IIIc genes between ICM and TE lineages cells become more clear during development from porcine blastocyst to elongated embryos, which indicates the possibility that in porcine embryos, functions of ICM and TE lineage cells depend on these gene expressions proceed as transition from blastocyst to elongated stage.
Figures


Similar articles
-
OCT-4 expression is essential for the segregation of trophectoderm lineages in porcine preimplantation embryos.J Reprod Dev. 2016 Aug 25;62(4):401-8. doi: 10.1262/jrd.2016-040. Epub 2016 May 20. J Reprod Dev. 2016. PMID: 27210587 Free PMC article.
-
Aberrant expression patterns of genes involved in segregation of inner cell mass and trophectoderm lineages in bovine embryos derived from somatic cell nuclear transfer.Cell Reprogram. 2010 Oct;12(5):617-25. doi: 10.1089/cell.2010.0017. Cell Reprogram. 2010. PMID: 20726774
-
TEAD4 regulates trophectoderm differentiation upstream of CDX2 in a GATA3-independent manner in the human preimplantation embryo.Hum Reprod. 2022 Jul 30;37(8):1760-1773. doi: 10.1093/humrep/deac138. Hum Reprod. 2022. PMID: 35700449
-
Roles of cell differentiation factors in preimplantation development of domestic animals.J Reprod Dev. 2021 Jun 21;67(3):161-165. doi: 10.1262/jrd.2021-031. Epub 2021 Apr 27. J Reprod Dev. 2021. PMID: 33907058 Free PMC article. Review.
-
Mechanisms of trophectoderm fate specification in preimplantation mouse development.Dev Growth Differ. 2010 Apr;52(3):263-73. doi: 10.1111/j.1440-169X.2009.01158.x. Epub 2010 Jan 20. Dev Growth Differ. 2010. PMID: 20100249 Review.
Cited by
-
Pre-fertilization approach using α-l-fucosidase modulates zona pellucida hardening during bovine in vitro embryo production.Vet Res Commun. 2024 Apr;48(2):1135-1147. doi: 10.1007/s11259-023-10291-y. Epub 2024 Jan 8. Vet Res Commun. 2024. PMID: 38191818
-
Induced pluripotent stem cells from farm animals.J Anim Sci. 2020 Nov 1;98(11):skaa343. doi: 10.1093/jas/skaa343. J Anim Sci. 2020. PMID: 33098420 Free PMC article. Review.
-
Effects of downregulating oct-4 transcript by RNA interference on early development of porcine embryos.J Reprod Dev. 2013;59(4):353-60. doi: 10.1262/jrd.2013-003. Epub 2013 Apr 29. J Reprod Dev. 2013. PMID: 23628850 Free PMC article.
-
OCT-4 expression is essential for the segregation of trophectoderm lineages in porcine preimplantation embryos.J Reprod Dev. 2016 Aug 25;62(4):401-8. doi: 10.1262/jrd.2016-040. Epub 2016 May 20. J Reprod Dev. 2016. PMID: 27210587 Free PMC article.
-
Cytokines from the pig conceptus: roles in conceptus development in pigs.J Anim Sci Biotechnol. 2014 Nov 7;5(1):51. doi: 10.1186/2049-1891-5-51. eCollection 2014. J Anim Sci Biotechnol. 2014. PMID: 25436109 Free PMC article. Review.
References
-
- Onishi A, Iwamoto M, Akita T, Mikawa S, Takeda K, Awata T, Hanada H, Perry AC. Pig cloning by microinjection of fetal fibroblast nuclei. Science 2000; 289: 1188–1190 - PubMed
-
- Kikuchi K, Onishi A, Kashiwazaki N, Iwamoto M, Noguchi J, Kaneko H, Akita T, Nagai T. Successful piglet production after transfer of blastocysts produced by a modified in vitro system. Biol Reprod 2002; 66: 1033–1041 - PubMed
-
- Nagai T, Funahashi H, Yoshioka K, Kikuchi K. Up date of in vitro production of porcine embryos. Front Biosci 2006; 11: 2565–2573 - PubMed
-
- Pedersen RA, Wu K, Balakier H. Origin of the inner cell mass in mouse embryos: cell lineage analysis by microinjection. Dev Biol 1986; 117: 581–595 - PubMed
-
- Cross JC. How to make placenta: mechanisms of trophoblast cell differentiation in mice-a review. Placenta2005; 26 (Suppl 3–9). - PubMed
Publication types
MeSH terms
Substances
LinkOut - more resources
Full Text Sources
Other Literature Sources
Research Materials
Miscellaneous

